
Impact of strategic and critical metals trade network characteristics on the upgrading of industrial structures
Received date: 2020-02-19
Request revised date: 2020-07-12
Online published: 2020-10-25
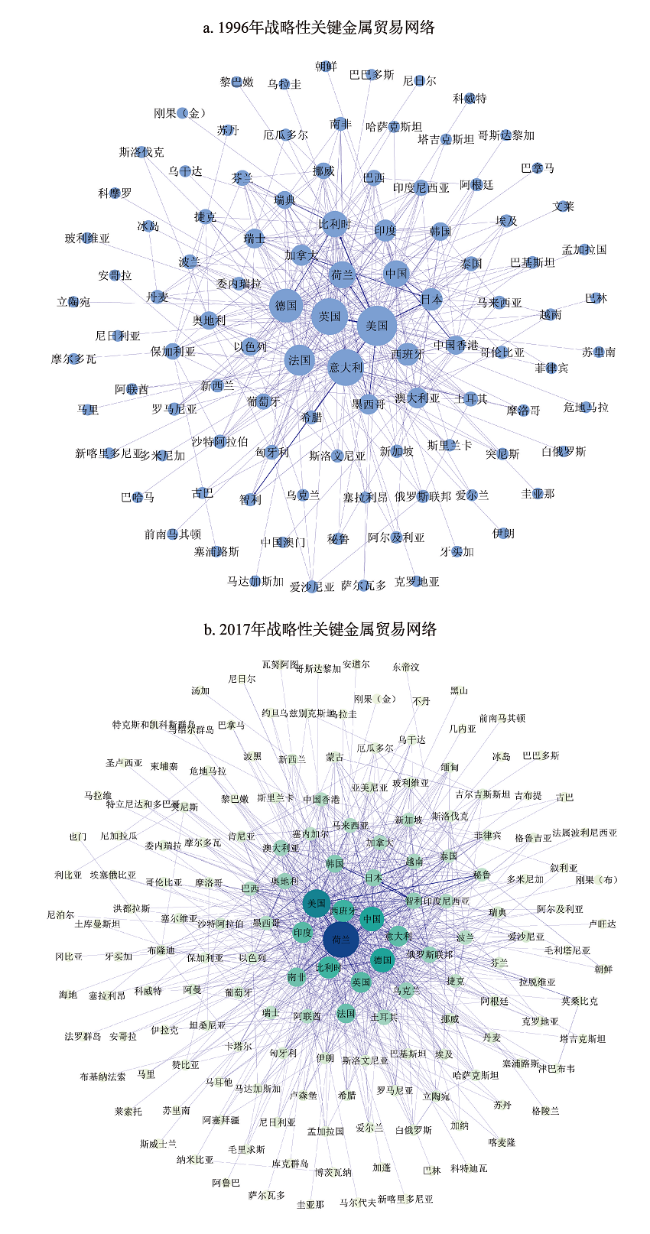
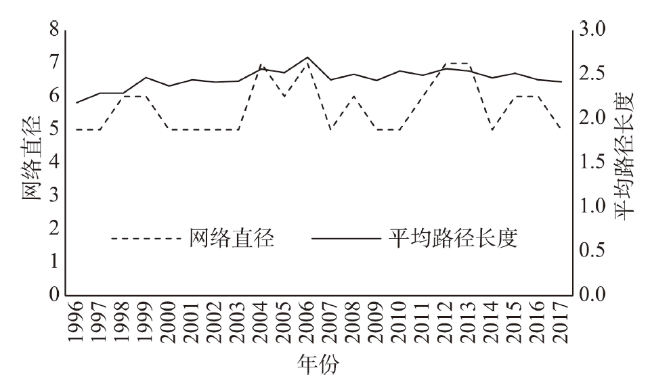
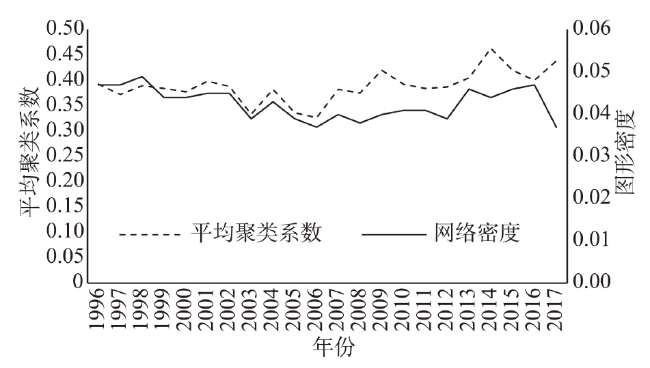
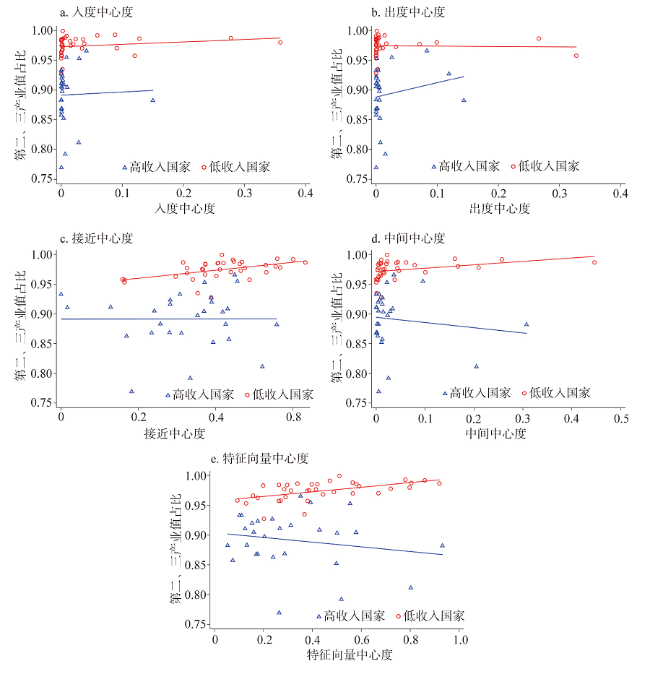
In order to investigate the impact of strategic and critical metals trade network characteristics on the upgrading of industrial structures, we quantitatively characterized the topological characteristics of the network based on complex network analysis methods, using the trade data of the seven strategic and critical metals from 1996 to 2017. This study measured the degree of centrality from five dimensions: in-degree centrality, out-degree centrality, closeness centrality, betweenness centrality, and eigenvector centrality. We deciphered the roles and positions of countries in the trade network. Based on these, this study further constructed a panel regression model to examine how the characteristics of strategic and critical metals trade network impact the industrial structure upgrading. The research results show that: (1) The global strategic and critical metals trade network is loose and heterogeneous during 1996-2017 and shows the characteristics of a “small world”. (2) Individually, China, the United States, and Germany were important participants in global strategic and critical metals trade, occupying a central position in the trade network. (3) Further research found that closeness centrality and betweenness centrality showed a significant effect on promoting the upgrading of a country’s industrial structure. This effect was more prominent in low-income countries. But the influence of in-degree centrality, out-degree centrality, and eigenvector centrality were not obvious. China should adopt a more open trade policy and enhance its position in the division of labor in the global value chain to promote the optimization and upgrading of its industrial structure.
ZHU Xuehong , PENG Ting , CHEN Jinyu . Impact of strategic and critical metals trade network characteristics on the upgrading of industrial structures[J]. Resources Science, 2020 , 42(8) : 1489 -1503 . DOI: 10.18402/resci.2020.08.05
表1 1996—2017年全球战略性关键金属贸易网络节点数和边数Table 1 The number of nodes and edges of the global strategic and critical metals trade network, 1996-2017 |
| 年份 | 1996 | 2001 | 2006 | 2011 | 2017 |
|---|---|---|---|---|---|
| 节点数/个 | 105 | 130 | 152 | 155 | 171 |
| 边数/条 | 509 | 761 | 857 | 982 | 1069 |
表2 1996—2017年全球战略性关键金属网络中心度排名前3的国家(地区)Table 2 Top three countries (region) of the global strategic and critical metals trade network in terms of centrality, 1996-2017 |
| 指标 | 入度中心度 | 出度中心度 | 接近中心度 | 中间中心度 | 特征向量中心度 | ||||||||||||||
|---|---|---|---|---|---|---|---|---|---|---|---|---|---|---|---|---|---|---|---|
| 排名 | 1 | 2 | 3 | 1 | 2 | 3 | 1 | 2 | 3 | 1 | 2 | 3 | 1 | 2 | 3 | ||||
| 1996 | 日本 | 英国 | 比利时 | 美国 | 澳大 利亚 | 比利时 | 厄瓜 多尔 | 土耳其 | 丹麦 | 美国 | 意大利 | 德国 | 德国 | 美国 | 意大利 | ||||
| 1998 | 日本 | 荷兰 | 英国 | 美国 | 智利 | 澳大 利亚 | 丹麦 | 圭亚那 | 坦桑尼亚 | 美国 | 德国 | 意大利 | 美国 | 德国 | 英国 | ||||
| 2000 | 日本 | 荷兰 | 美国 | 美国 | 中国 | 智利 | 约旦 | 坦桑尼亚 | 丹麦 | 美国 | 南非 | 意大利 | 美国 | 中国 | 德国 | ||||
| 2002 | 荷兰 | 日本 | 英国 | 智利 | 中国 | 美国 | 沙特阿 拉伯 | 卡塔尔 | 塞尔维亚 和黑山 | 美国 | 中国 | 英国 | 中国 | 英国 | 印度 | ||||
| 2004 | 荷兰 | 日本 | 智利 | 智利 | 中国 | 秘鲁 | 毛里求斯 | 突尼斯 | 克罗地亚 | 美国 | 德国 | 南非 | 中国 | 美国 | 德国 | ||||
| 2006 | 荷兰 | 日本 | 比利时 | 智利 | 美国 | 中国 | 毛里求斯 | 立陶宛 | 洪都拉斯 | 美国 | 印度 | 中国 | 中国 | 美国 | 德国 | ||||
| 2008 | 荷兰 | 日本 | 智利 | 智利 | 美国 | 秘鲁 | 立陶宛 | 斐济 | 毛里求斯 | 美国 | 印度 | 中国 | 中国 | 美国 | 德国 | ||||
| 2010 | 荷兰 | 日本 | 中国 | 智利 | 美国 | 中国 | 孟加拉国 | 斯洛文 尼亚 | 阿拉伯联 合酋长国 | 美国 | 南非 | 中国 | 中国 | 印度 | 美国 | ||||
| 2012 | 荷兰 | 日本 | 中国 | 美国 | 智利 | 中国 | 布隆迪 | 巴林 | 斐济 | 中国 | 美国 | 意大利 | 中国 | 美国 | 德国 | ||||
| 2014 | 荷兰 | 日本 | 美国 | 美国 | 智利 | 墨西哥 | 沙特阿 拉伯 | 埃及 | 贝宁 | 中国 | 美国 | 德国 | 中国 | 美国 | 日本 | ||||
| 2016 | 荷兰 | 日本 | 中国 | 智利 | 美国 | 南非 | 新西兰 | 布基纳 法索 | 巴拿马 | 中国 | 美国 | 荷兰 | 中国 | 荷兰 | 美国 | ||||
| 2017 | 日本 | 中国 | 芬兰 | 智利 | 美国 | 南非 | 阿曼 | 博茨瓦纳 | 尼加拉瓜 | 荷兰 | 美国 | 中国 | 中国 | 美国 | 印度 | ||||
表3 1996—2017年全球战略性关键金属网络国家(地区)平均中心度排名(前10)Table 3 Ranking of countries (regions) in the global strategic and critical metals trade network in terms of average centrality (Top10), 1996-2017 |
| 国家 | 入度中心度 | 出度中心度 | 接近中心度 | 中间中心度 | 特征向量中心度 | 收入组别 |
|---|---|---|---|---|---|---|
| 中国 | 3 | 3 | 5 | 2 | 1 | 低收入组 |
| 美国 | 4 | 2 | 1 | 1 | 2 | 高收入组 |
| 德国 | 8 | 12 | 2 | 3 | 3 | 高收入组 |
| 日本 | 2 | 25 | 12 | 13 | 4 | 高收入组 |
| 印度 | 14 | 14 | 9 | 5 | 5 | 低收入组 |
| 荷兰 | 1 | 5 | 6 | 6 | 6 | 高收入组 |
| 英国 | 7 | 24 | 4 | 7 | 7 | 高收入组 |
| 意大利 | 10 | 10 | 3 | 4 | 8 | 高收入组 |
| 韩国 | 6 | 13 | 19 | 28 | 9 | 高收入组 |
| 法国 | 18 | 30 | 8 | 10 | 10 | 高收入组 |
注:表中按各国特征向量中心度平均值升序排列。 |
表4 整体回归结果Table 4 Overall regression results |
| 产业结构(1) | 产业结构(2) | 产业结构(3) | 产业结构(4) | 产业结构(5) | |
|---|---|---|---|---|---|
| 接近中心度(标准化) | 0.00622*** | ||||
| (0.00200) | |||||
| 中间中心度(标准化) | 0.0275*** | ||||
| (0.00904) | |||||
| 特征向量中心度(标准化) | -0.00479 | ||||
| (0.00499) | |||||
| 入度中心度(标准化) | 0.00699 | ||||
| (0.00750) | |||||
| 出度中心度(标准化) | 0.00575 | ||||
| (0.00754) | |||||
| 外商直接投资占GDP比重 | 0.0254*** | 0.0242*** | 0.0251*** | 0.0235*** | 0.0248*** |
| (0.00743) | (0.00744) | (0.00745) | (0.00768) | (0.00748) | |
| 城镇人口占总人口比重 | -0.0525*** | -0.0644*** | -0.0534*** | -0.0572*** | -0.0539*** |
| (0.0190) | (0.0193) | (0.0190) | (0.0196) | (0.0191) | |
| 高技术产品出口占制成品出口比重 | -0.00106 | -0.00331 | -0.00213 | -0.00270 | -0.00272 |
| (0.00806) | (0.00805) | (0.00808) | (0.00807) | (0.00807) | |
| 第二、三产业就业占比 | 0.112*** | 0.109*** | 0.111*** | 0.112*** | 0.111*** |
| (0.0211) | (0.0211) | (0.0212) | (0.0212) | (0.0212) | |
| log(人均GDP) | 0.205*** | 0.213*** | 0.216*** | 0.214*** | 0.213*** |
| (0.0177) | (0.0176) | (0.0178) | (0.0177) | (0.0176) | |
| log(人均GDP)2 | -0.0218*** | -0.0228*** | -0.0231*** | -0.0230*** | -0.0228*** |
| (0.00225) | (0.00223) | (0.00226) | (0.00224) | (0.00224) | |
| 私营部门的国内信贷占GDP比重 | 0.00683*** | 0.00656*** | 0.00681*** | 0.00698*** | 0.00696*** |
| (0.00209) | (0.00209) | (0.00210) | (0.00209) | (0.00210) | |
| 常量 | 0.400*** | 0.395*** | 0.381*** | 0.385*** | 0.386*** |
| (0.0293) | (0.0290) | (0.0294) | (0.0290) | (0.0290) | |
| 豪斯曼检验(chi2) | 62.76 | 78.96 | 62.89 | 62.27 | 63.36 |
| Prob>chi2 | 0.0000 | 0.0000 | 0.0000 | 0.0000 | 0.0000 |
| 模型 | 固定效应 | 固定效应 | 固定效应 | 固定效应 | 固定效应 |
| R2 | 0.9412 | 0.9411 | 0.9408 | 0.9408 | 0.9408 |
| 调整后的R2 | 0.9380 | 0.9380 | 0.9376 | 0.9376 | 0.9376 |
| F统计量 | 301.01 | 300.90 | 298.92 | 298.91 | 298.84 |
| Prob>F | 0.0000 | 0.0000 | 0.0000 | 0.0000 | 0.0000 |
| 观测量 | 1408 | 1408 | 1408 | 1408 | 1408 |
注:括号里的数字代表t值;***、**、*分别表示1%、5%和10%水平上变量显著。 |
表5 高收入组回归结果Table 5 Regression results of the high income group |
| 产业结构(1) | 产业结构(2) | 产业结构(3) | 产业结构(4) | 产业结构(5) | |
|---|---|---|---|---|---|
| 接近中心度(标准化) | 0.00329** | ||||
| (0.00138) | |||||
| 中间中心度(标准化) | 0.00549 | ||||
| (0.00600) | |||||
| 特征向量中心度(标准化) | 0.00183 | ||||
| (0.00337) | |||||
| 入度中心度(标准化) | -0.00372 | ||||
| (0.00418) | |||||
| 出度中心度(标准化) | 0.00426 | ||||
| (0.00443) | |||||
| 外商直接投资占GDP比重 | 0.0196*** | 0.0194*** | 0.0196*** | 0.0205*** | 0.0192*** |
| (0.00403) | (0.00405) | (0.00404) | (0.00417) | (0.00405) | |
| 城镇人口占总人口比重 | 0.0417** | 0.0395** | 0.0436*** | 0.0470*** | 0.0412** |
| (0.0164) | (0.0167) | (0.0165) | (0.0172) | (0.0165) | |
| 高技术产品出口占制成品出口比重 | -0.00681 | -0.00785 | -0.00795 | -0.00793 | -0.00787 |
| (0.00660) | (0.00661) | (0.00661) | (0.00661) | (0.00661) | |
| 第二、三产业就业占比 | 0.122*** | 0.123*** | 0.123*** | 0.121*** | 0.126*** |
| (0.0268) | (0.0269) | (0.0269) | (0.0271) | (0.0270) | |
| log(人均GDP) | 0.0579** | 0.0627** | 0.0593** | 0.0608** | 0.0591** |
| (0.0246) | (0.0247) | (0.0248) | (0.0247) | (0.0247) | |
| log(人均GDP)2 | -0.00524* | -0.00584** | -0.00543* | -0.00559* | -0.00543* |
| (0.00291) | (0.00293) | (0.00293) | (0.00292) | (0.00292) | |
| 私营部门的国内信贷占GDP比重 | 0.00520*** | 0.00527*** | 0.00544*** | 0.00533*** | 0.00525*** |
| (0.00126) | (0.00126) | (0.00128) | (0.00126) | (0.00127) | |
| 常量 | 0.628*** | 0.621*** | 0.623*** | 0.619*** | 0.625*** |
| (0.0527) | (0.0528) | (0.0529) | (0.0529) | (0.0529) | |
| 豪斯曼检验(chi2) | 16.94 | 15.60 | 19.74 | 17.12 | 16.46 |
| Prob>chi2 | 0.0308 | 0.0484 | 0.0114 | 0.0289 | 0.0362 |
| 模型 | 固定效应 | 固定效应 | 固定效应 | 固定效应 | 固定效应 |
| R2 | 0.8474 | 0.8464 | 0.8463 | 0.8464 | 0.8464 |
| 调整后的R2 | 0.8386 | 0.8376 | 0.8375 | 0.8376 | 0.8376 |
| F统计量 | 96.61 | 95.87 | 95.79 | 95.87 | 95.89 |
| Prob>F | 0.0000 | 0.0000 | 0.0000 | 0.0000 | 0.0000 |
| 观测量 | 792 | 792 | 792 | 792 | 792 |
表6 低收入组回归结果Table 6 Regression results of the low income group |
| 产业结构(1) | 产业结构(2) | 产业结构(3) | 产业结构(4) | 产业结构(5) | |
|---|---|---|---|---|---|
| 接近中心度(标准化) | 0.00843** | ||||
| (0.00416) | |||||
| 中间中心度(标准化) | 0.0474** | ||||
| (0.0210) | |||||
| 特征向量中心度(标准化) | -0.00466 | ||||
| (0.0110) | |||||
| 入度中心度(标准化) | 0.0302 | ||||
| (0.0344) | |||||
| 出度中心度(标准化) | 0.0110 | ||||
| (0.0225) | |||||
| 外商直接投资占GDP比重 | 0.0359 | 0.0355 | 0.0317 | 0.0338 | 0.0319 |
| (0.0362) | (0.0362) | (0.0364) | (0.0363) | (0.0364) | |
| 城镇人口占总人口比重 | -0.133*** | -0.152*** | -0.135*** | -0.143*** | -0.138*** |
| (0.0335) | (0.0341) | (0.0337) | (0.0345) | (0.0337) | |
| 高技术产品出口占制成品出口比重 | 0.0133 | 0.00772 | 0.0129 | 0.0103 | 0.0117 |
| (0.0147) | (0.0148) | (0.0148) | (0.0149) | (0.0148) | |
| 第二、三产业就业占比 | 0.128*** | 0.121*** | 0.127*** | 0.126*** | 0.126*** |
| (0.0327) | (0.0328) | (0.0328) | (0.0328) | (0.0328) | |
| log(人均GDP) | 0.229*** | 0.221*** | 0.247*** | 0.241*** | 0.242*** |
| (0.0427) | (0.0433) | (0.0428) | (0.0423) | (0.0423) | |
| log(人均GDP)2 | -0.0241*** | -0.0226*** | -0.0264*** | -0.0255*** | -0.0257*** |
| (0.00605) | (0.00616) | (0.00610) | (0.00602) | (0.00603) | |
| 私营部门的国内信贷占GDP比重 | 0.00336 | 0.00328 | 0.00299 | 0.00329 | 0.00327 |
| (0.00625) | (0.00624) | (0.00627) | (0.00628) | (0.00632) | |
| 常量 | 0.384*** | 0.413*** | 0.351*** | 0.369*** | 0.362*** |
| (0.0741) | (0.0770) | (0.0745) | (0.0743) | (0.0738) | |
| 豪斯曼检验(chi2) | 39.28 | 46.89 | 40.06 | 40.68 | 41.24 |
| Prob>chi2 | 0.0000 | 0.0000 | 0.0000 | 0.0000 | 0.0000 |
| 模型 | 固定效应 | 固定效应 | 固定效应 | 固定效应 | 固定效应 |
| R2 | 0.8791 | 0.8793 | 0.8783 | 0.8784 | 0.8783 |
| 调整后的R2 | 0.8718 | 0.8720 | 0.8710 | 0.8711 | 0.8710 |
| F统计量 | 120.53 | 120.76 | 119.61 | 119.74 | 119.62 |
| Prob>F | 0.0000 | 0.0000 | 0.0000 | 0.0000 | 0.0000 |
| 观测量 | 616 | 616 | 616 | 616 | 616 |
| [1] |
中华人民共和国国务院. 全国矿产资源规划(2016-2020年)[EB/OL]. (2016-11-08) [2020-02-19]. http://www.gov.cn/zhengce/content/2016-11/08/content_5129991.htm.
[The State Council of the People’s Republic of China. National Mineral Resources Planning (2016-2020)[EB/OL]. (2016-11-08) [2020-02-19]. http://www.gov.cn/zhengce/content/2016-11/08/content_5129991.htm. ]
|
| [2] |
王昶, 宋慧玲, 左绿水, 等. 国家金属资源安全研究回顾与展望[J]. 资源科学, 2017,39(5):805-817.
[
|
| [3] |
于会录, 董锁成, 李宇, 等. 丝绸之路经济带资源格局与合作开发模式研究[J]. 资源科学, 2014,36(12):2468-2475.
[
|
| [4] |
|
| [5] |
|
| [6] |
|
| [7] |
程淑佳, 赵映慧, 李秀敏. 基于复杂网络理论的原油贸易空间格局差异分析[J]. 中国人口·资源与环境, 2013,23(8):20-25.
[
|
| [8] |
|
| [9] |
|
| [10] |
|
| [11] |
|
| [12] |
|
| [13] |
|
| [14] |
|
| [15] |
|
| [16] |
|
| [17] |
|
| [18] |
|
| [19] |
|
| [20] |
|
| [21] |
|
| [22] |
|
| [23] |
|
| [24] |
董迪, 安海忠, 郝晓晴, 等. 基于复杂网络的国际铜矿石贸易格局[J]. 经济地理, 2016,36(10):93-101.
[
|
| [25] |
史超亚, 高湘昀, 孙晓奇, 等. 复杂网络视角下的国际铝土矿贸易演化特征研究[J]. 中国矿业, 2018,27(1):57-62.
[
|
| [26] |
|
| [27] |
|
| [28] |
|
| [29] |
马远, 徐俐俐. “一带一路”沿线国家天然气贸易网络结构及影响因素[J]. 世界经济研究, 2017, (3):109-122.
[
|
| [30] |
|
| [31] |
马述忠, 任婉婉, 吴国杰. 一国农产品贸易网络特征及其对全球价值链分工的影响: 基于社会网络分析视角[J]. 管理世界, 2016, (3):60-72.
[
|
| [32] |
许和连, 成丽红, 孙天阳. 离岸服务外包网络与服务业全球价值链提升[J]. 世界经济, 2018,41(6):77-101.
[
|
| [33] |
|
| [34] |
刘立涛, 沈镭, 刘晓洁, 等. 基于复杂网络理论的中国石油流动格局及供应安全分析[J]. 资源科学, 2017,39(8):1431-1443.
[
|
| [35] |
刘艳, 黄健柏, 谌金宇. 全球铜矿石资源流动的网络关联及影响因素分析[J]. 统计与决策, 2017, (7):146-149.
[
|
| [36] |
|
| [37] |
|
| [38] |
|
| [39] |
|
| [40] |
顾雪松, 韩立岩, 周伊敏. 产业结构差异与对外直接投资的出口效应: “中国-东道国”视角的理论与实证[J]. 经济研究, 2016, (4):102-115.
[
|
| [41] |
干春晖, 郑若谷, 余典范. 中国产业结构变迁对经济增长和波动的影响[J]. 经济研究, 2011, (5):4-16.
[
|
| [42] |
栾申洲. 对外贸易、外商直接投资与产业结构优化[J]. 工业技术经济, 2018,37(1):86-92.
[
|
| [43] |
张林. 中国双向FDI、金融发展与产业结构优化[J]. 世界经济研究, 2016, (10):111-124.
[
|
| [44] |
张宗益, 伍焓熙. 新型城镇化对产业结构升级的影响效应分析[J]. 工业技术经济, 2015,34(5):101-109.
[
|
| [45] |
孙叶飞, 夏青, 周敏. 新型城镇化发展与产业结构变迁的经济增长效应[J]. 数量经济技术经济研究, 2016,33(11):23-40.
[
|
| [46] |
高远东, 张卫国, 阳琴. 中国产业结构高级化的影响因素研究[J]. 经济地理, 2015,35(6):96-101.
[
|
| [47] |
李娟, 万璐, 唐珮菡. 产业转型升级、贸易开放与中国劳动市场波动[J]. 中国人口·资源与环境, 2014,24(1):140-147.
[
|
| [48] |
景跃军, 张昀. 我国劳动力就业结构与产业结构相关性及协调性分析[J]. 人口学刊, 2015,37(5):85-93.
[
|
| [49] |
刘伟, 蔡志洲. 新时代中国经济增长的国际比较及产业结构升级[J]. 管理世界, 2018,34(1):16-24.
[
|
| [50] |
陶爱萍, 徐君超. 金融发展与产业结构升级非线性关系研究: 基于门槛模型的实证检验[J]. 经济经纬, 2016,33(2):84-89.
[
|
| [51] |
|
| [52] |
孔含笑, 沈镭, 钟帅. “一带一路”产油国经济增长与石油生产和贸易的动态关系研究[J]. 资源科学, 2017,39(6):1071-1083.
[
|
| [53] |
|
/
| 〈 |
|
〉 |