
International comparison of carbon intensity from the perspective of economic development levels and industrial transfers
Received date: 2019-01-03
Request revised date: 2019-06-05
Online published: 2019-10-25
Copyright
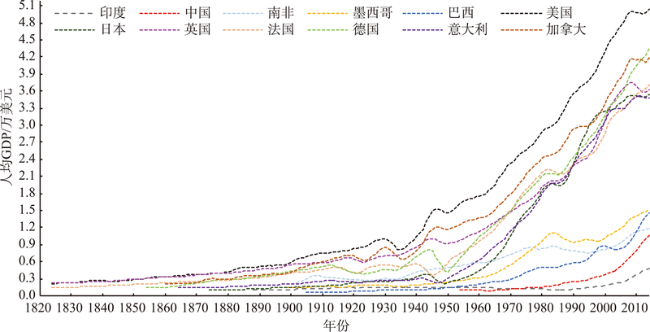
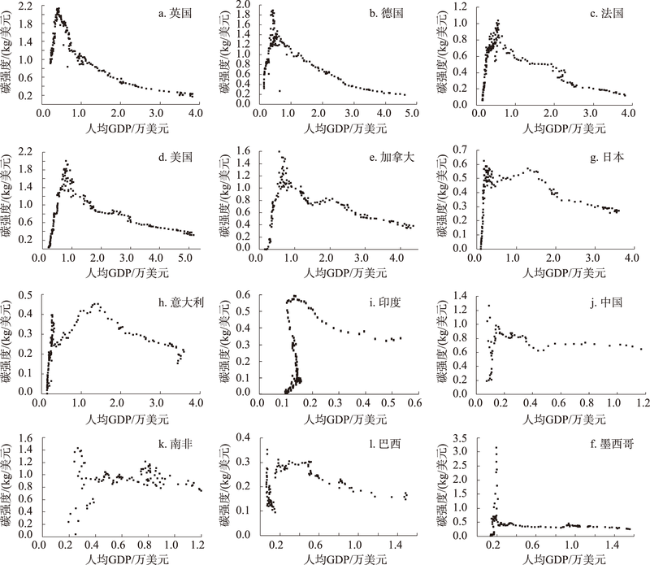
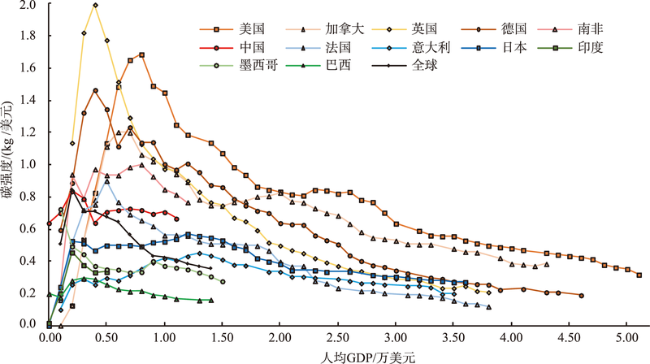
With the accelerated progress of global industrial transfers and industrialization of developing countries, global carbon emissions are rising rapidly. To depict the contribution of countries to global carbon emissions, this study selected seven major industrialized countries (the United States, Canada, the United Kingdom, Germany, France, Italy, Japan) and five emerging economies (China, India, Mexico, Brazil, South Africa), and used regression analysis to describe the changing trends of carbon intensity of these countries along with economic development, compare the carbon intensities of different countries at the same level of economic development, and analyze carbon intensity changes of relevant countries during different rounds of international industrial transfers. Our study found that with economic growth the carbon intensities of major industrialized countries showed a general downward trend after initial increase. Under low economic development level, the carbon intensity distributions of emerging economies were relatively discrete. However, with the improvement of economic development level, the carbon intensities of these countries still present a general trend of decline. At the same economic development level, the mean carbon intensity level of industrialized countries is higher than that of emerging economies. Under the background of international industry transfers, the carbon intensities of industries transferred abroad have mostly decreased, while those of receiving countries have increased as a whole. The results of this study can provide scientific basis for the allocation of carbon emission rights and expand a new perspective for global climate change mitigation research.
JIANG Wanbei , HAN Mengyao , TANG Zhipeng , LIU Weidong . International comparison of carbon intensity from the perspective of economic development levels and industrial transfers[J]. Resources Science, 2019 , 41(10) : 1814 -1823 . DOI: 10.18402/resci.2019.10.05
表1 研究国别时间序列及对应人均GDP水平Table 1 Time series range and related per capita GDP levels of case countries |
| 中国 | 印度 | 南非* | 墨西哥* | 巴西 | 日本 | |
|---|---|---|---|---|---|---|
| 年份 | 1950—2014 | 1884—2014 | 1891—2014 | 1895—2014 | 1901—2014 | 1870—2014 |
| 人均GDP/万美元 | 0.08~1.18 | 0.10~0.53 | 0.20~1.20 | 0.13~1.55 | 0.64~1.49 | 0.10~3.60 |
| 美国 | 加拿大* | 英国 | 法国 | 德国 | 意大利 | |
| 年份 | 1820—2014 | 1820—2014 | 1820—2014 | 1820—2014 | 1850—2014 | 1860—2014 |
| 人均GDP/万美元 | 0.21~5.17 | 0.15~4.36 | 0.22~3.82 | 0.14~3.81 | 0.14~4.60 | 0.14~3.59 |
注:*表示某些年份的数据有缺失。 |
表2 四次国际产业转移Table 2 Four international industrial transfers |
| 时间 | 主要转出与转入区域 | 转移产业 |
|---|---|---|
| 19世纪下半叶—20世纪上半叶 | 英国→法国、德国等欧洲大陆国家及北美国家 | 制造业 |
| 20世纪50—60年代 | 美国→日本和德国 | 钢铁、纺织等传统产业 |
| 20世纪70—80年代 | 美国、日本→东亚和部分拉美地区 | 轻工等劳动密集型加工产业 |
| 20世纪90年代至今 | 美国、日本、“四小龙”→东盟四国,主要是中国内地 | 劳动、资本和一般技术密集型产业 |
表3 人均GDP大于1.20万美元后碳强度与人均GDP的线性拟合Table 3 Linear fitting of carbon intensity and per capita GDP with GDP above 12000 US$ |
| 德国 | 英国 | 美国 | 法国 | 加拿大 | 日本 | 意大利 | |
|---|---|---|---|---|---|---|---|
| R2 | 0.93*** | 0.90*** | 0.94*** | 0.88*** | 0.92*** | 0.88*** | 0.93*** |
| 回归系数 | -0.25*** | -0.24*** | -0.20*** | -0.18*** | -0.16*** | -0.11*** | -0.10*** |
注:***表示在0.01水平下通过显著性检验。 |
表4 产业转移视角下碳强度变化、人均GDP变化及碳强度的变化速度Table 4 Carbon intensity change, per capita GDP change, and carbon intensity change rates from the industrial transfer perspective |
| 年代 产业转移方向 | 19世纪下半叶—20世纪上半叶 英国→欧洲大陆和美国 | 20世纪50—60年代 美国→日本和德国 | ||||||
|---|---|---|---|---|---|---|---|---|
| 国家 | 碳强度 /(kg/美元) | 人均GDP /万美元 | 变化速度 /((kg/美元)/万美元) | 碳强度 /(kg/美元) | 人均GDP /万美元 | 变化速度 /((kg/美元)/万美元) | ||
| 中国 | 0.22→0.58 | 0.09→0.11 | 18.00 | |||||
| 印度 | 0.01→0.11 | 0.10→0.14 | 2.50 | 0.11→0.28 | 0.14→0.12 | -8.50 | ||
| 南非 | 0.27→1.00 | 0.23→0.49 | 2.81 | 1.00→0.90 | 0.49→0.71 | -0.45 | ||
| 墨西哥 | 0.04→0.46 | 0.14→0.24 | 4.20 | 0.46→0.36 | 0.24→0.52 | -0.36 | ||
| 巴西 | 0.20→0.12 | 0.06→0.14 | -1.00 | 0.12→0.29 | 0.14→0.28 | 1.21 | ||
| 日本 | 0.00→0.47 | 0.10→0.21 | 4.27 | 0.47→0.52 | 0.21→0.96 | 0.07 | ||
| 美国 | 0.26→1.12 | 0.28→1.46 | 0.73 | 1.12→0.81 | 1.46→2.29 | -0.37 | ||
| 加拿大 | 0.01→0.94 | 0.20→1.17 | 0.96 | 0.95→0.77 | 1.17→1.75 | -0.31 | ||
| 英国 | 1.38→0.99 | 0.29→0.93 | -0.61 | 0.99→0.78 | 0.93→1.44 | -0.41 | ||
| 法国 | 0.26→0.83 | 0.20→0.52 | 1.78 | 0.83→0.51 | 0.52→1.44 | -0.35 | ||
| 德国 | 0.41→1.15 | 0.14→0.43 | 2.55 | 1.15→0.88 | 0.43→1.45 | -0.26 | ||
| 意大利 | 0.02→0.20 | 0.14→0.27 | 1.38 | 0.20→0.41 | 0.27→1.07 | 0.26 | ||
| 年代 产业转移方向 | 20世纪70—80年代 美国、日本→东亚、拉美、中国东部沿海 | 20世纪90年代至今 美国、日本、东亚→中国内地 | ||||||
| 国家 | 碳强度/ (kg/美元) | 人均GDP/万美元 | 变化速度/((kg/美元)/万美元) | 碳强度/(kg/美元) | 人均GDP/万美元 | 变化速度/((kg/美元)/万美元) | ||
| 中国 | 0.58→0.82 | 0.11→0.25 | 1.71 | 0.82→0.69 | 0.25→1.06 | -0.16 | ||
| 印度 | 0.28→0.56 | 0.12→0.11 | -28.00 | 0.56→0.33 | 0.11→0.49 | -0.61 | ||
| 南非 | 0.90→1.16 | 0.71→0.80 | 2.89 | 1.16→0.77 | 0.80→1.18 | -1.03 | ||
| 墨西哥 | 0.36→0.41 | 0.52→0.95 | 0.12 | 0.41→0.28 | 0.95→1.51 | -0.23 | ||
| 巴西 | 0.29→0.25 | 0.28→0.57 | -0.14 | 0.25→0.16 | 0.57→1.45 | -0.10 | ||
| 日本 | 0.52→0.36 | 0.96→2.18 | -0.13 | 0.36→0.27 | 2.18→3.53 | -0.07 | ||
| 美国 | 0.81→0.56 | 2.29→3.48 | -0.21 | 0.56→0.33 | 3.48→5.04 | -0.15 | ||
| 加拿大 | 0.77→0.57 | 1.75→2.87 | -0.18 | 0.57→0.36 | 2.87→4.18 | -0.16 | ||
| 英国 | 0.78→0.45 | 1.44→2.22 | -0.42 | 0.45→0.20 | 2.22→3.64 | -0.18 | ||
| 法国 | 0.51→0.30 | 1.44→2.25 | -0.26 | 0.30→0.14 | 2.25→3.71 | -0.11 | ||
| 德国 | 0.88→0.56 | 1.45→2.37 | -0.35 | 0.56→0.21 | 2.37→4.36 | -0.18 | ||
| 意大利 | 0.41→0.31 | 1.07→2.21 | -0.09 | 0.31→0.18 | 2.21→3.47 | -0.10 | ||
注:变化速度指碳强度变化量/人均GDP变化量。 |
| [1] |
World Bank Group.CO2 Emissions(kt)[EB/OL].( 2019 -07-16) [2019-07-17].
|
| [2] |
朱江玲, 岳超, 王少鹏 , 等. 1850—2008年中国及世界主要国家的碳排放: 碳排放与社会发展I[J]. 北京大学学报(自然科学版), 2010,46(4):497-504.
[
|
| [3] |
姚从容 . 人口规模、经济增长与碳排放: 经验证据及国际比较[J]. 经济地理, 2012,32(3):138-145.
[
|
| [4] |
陈武, 常燕, 李云峰 . 中国低碳发展的国际比较研究: 基于历史和经济发展阶段的审视[J]. 中国人口·资源与环境, 2012,22(7):1-7.
[
|
| [5] |
戴君虎, 王焕炯, 刘亚辰 , 等. 人均历史累积碳排放3种算法及结果对比分析[J]. 第四纪研究, 2014,34(4):823-829.
[
|
| [6] |
万超, 马晓明 . 中日碳排放的比较研究及对中国低碳经济发展的启示[J]. 世界农业, 2012, ( 9):73-77.
[
|
| [7] |
韩梦瑶, 刘卫东, 唐志鹏 , 等. 世界主要国家碳排放影响因素分析: 基于变系数面板模型[J]. 资源科学, 2017,39(12):2420-2429.
[
|
| [8] |
周伟, 米红 . 中国碳排放: 国际比较与减排战略[J]. 资源科学, 2010,32(8):1570-1577.
[
|
| [9] |
|
| [10] |
|
| [11] |
|
| [12] |
|
| [13] |
谢伏瞻 . 全球制造业的发展趋势与中国的选择[J]. 理论前沿, 2004, ( 1):8-10.
[
|
| [14] |
马丽, 张琳 . 国际制造业转移与碳转移的时空耦合效应[J]. 资源科学, 2017,39(12):2408-2419.
[
|
| [15] |
王丽丽, 王媛, 毛国柱 , 等. 中国国际贸易隐含碳SDA分析[J]. 资源科学, 2012,34(12):2382-2389.
[
|
| [16] |
|
| [17] |
|
| [18] |
卢根鑫 . 国际产业转移论[M]. 上海: 上海人民出版社, 1997.
[
|
| [19] |
|
| [20] |
曲建升, 曾静静, 张志强 . 国际主要温室气体排放数据集比较分析研究[J]. 地球科学进展, 2008,23(1):47-54.
[
|
| [21] |
|
| [22] |
|
| [23] |
|
| [24] |
潘悦 . 国际产业转移的四次浪潮及其影响[J]. 现代国际关系, 2006, ( 4):23-27.
[
|
| [25] |
赵建吉, 茹乐峰, 段小微 , 等. 产业转移的经济地理学研究: 进展与展望[J]. 经济地理, 2014,34(1):1-6.
[
|
| [26] |
张志强, 曾静静, 曲建升 . 世界主要国家碳排放强度历史变化趋势及相关关系研究[J]. 地球科学进展, 2011,26(8):859-869.
[
|
| [27] |
中国科学院可持续发展战略研究组. 2009 中国可持续发展战略报告: 探索中国特色的低碳道路[M]. 北京: 科学出版社, 2009.
[ Sustainable Development Strategy Research Group of CAS. China Sustainable Development Strategy Report 2009: China’s Approach Towards a Low Carbon Future[M]. Beijing: Science Press, 2009.]
|
| [28] |
UNFCCC. UNFCCC Process-and-Meetings[EB/OL] . ( 2019 -07-11) [2019-07-17].
|
/
| 〈 |
|
〉 |