
An innovative allowance allocation method in China’s unified national emissions trading scheme
Received date: 2018-09-08
Request revised date: 2018-12-06
Online published: 2019-05-25
Copyright
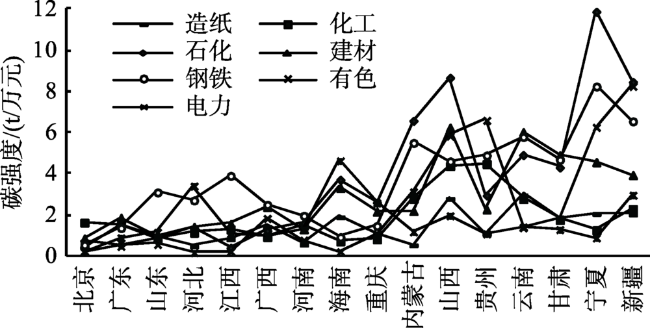
The imbalance of regional emissions is a peculiarity for China’s unified carbon market. However, neither grandfathering method nor benchmarking method can avoid punishing good performers and applying too much pressure on poor performers. By examining existing research on allowance allocation, we found that in China’s carbon market, the grandfathering method faces a dilemma of choosing a fixed-base-year or a rolling-base-year, and the benchmarking method faces a dilemma ofwhether to apply the principle of “one benchmark for one product.” Based on the principle of common but differentiated responsibility for emission reduction, this studyproposeda new method of allowance allocation, that is, grandfathering-benchmarking approaching method. Then, using this method to simulate the allowance allocation and comparing the result with the methods of grandfathering and benchmarking alone,the results show that the grandfathering-benchmarking approaching method not only can avoid punishing good performers and applying too much pressure on poor performers, but also work in coordination with carbon reduction target. Comparing with the other two methods, itsemission control coefficientis fair, the allocation resultis more accurate, and the cost of emission reduction is more acceptable. It has better performance in reducing the risk of worsening regional economic imbalance.The conclusion of the study shows thatgrandfathering-benchmarking approaching methodcan deal with the situation of strong regional emission disparity. It can be used as a reference for the selection and optimization of allowanceallocation method in the initial stage of China’s unified carbon market.
ZHAO Yongbin , CONG Jianhui , YANG Jun , ZHANG Yixuan . An innovative allowance allocation method in China’s unified national emissions trading scheme[J]. Resources Science, 2019 , 41(5) : 872 -883 . DOI: 10.18402/resci.2019.05.05
Figure 1 Inter-provincial differences in carbon intensity of key carbon emission industries in China, 2014图1 2014年中国重点行业的省际碳排放差异 |
Table 1 Estimation results of China's economic development and carbon emission scenarios in 2030表1 2030年中国经济发展和碳排放情景预估结果 |
| 指标 | 2005年 | 2015年 | 2020年 | 2025年 | 2030年 |
|---|---|---|---|---|---|
| GDP增长率(五年均值)(GRGDP)/% | — | — | 6.46 | 5.62 | 4.92 |
| GDP/万亿元 | 27.04 | 68.64 | 93.87 | 123.38 | 156.86 |
| 第二产业增加值占比(SS)/% | 46.90 | 42.00 | 36.50 | 33.80 | 31.80 |
| 第二产业增加值(AVS)/万亿元 | 12.68 | 28.83 | 34.26 | 41.70 | 49.88 |
| 工业增加值/第二产业增加值(SI/S)/% | 88.74 | 81.58 | 82.24 | 87.00 | 90.00 |
| 工业增加值(AVI)/万亿元 | 11.34 | 23.52 | 28.18 | 36.28 | 44.89 |
| 工业增加值率(VARI)/% | 42.63 | 21.30 | — | — | 26.50 |
| 制造业增加值率(VARM)/% | 0.194 | 0.205 | 0.225 | 0.245 | 0.265 |
| 单位GDP碳排放(CC/GDP)/(t/万元) | 2.16 | 1.35 | 1.15 | 0.93 | 0.76 |
| 单位工业增加值碳排放(CC/AVI)/(t/万元) | 3.66 | 3.05 | 2.38 | 1.83 | 1.43 |
| 社会排放总量(CGDP)/亿t | 58.41 | 92.66 | 107.95 | 114.74 | 118.48 |
| 工业碳排放量(CI)/亿t | 41.45 | 71.80 | 81.59 | 66.46 | 64.15 |
注:表中所有增加值和产值的数值均用2015年价格表示。 |
Table 2 Comparison of total allowancesof three allocation methods表2 3种配额分配方法的行业配额总量对比 |
| 行业碳配额/亿t | 造纸 | 石化 | 化工 | 建材 | 钢铁 | 有色 | 电力 |
|---|---|---|---|---|---|---|---|
| 历史法 | 0.760 | 2.578 | 6.050 | 5.264 | 8.906 | 3.525 | 4.175 |
| 基准线法 | 0.757 | 2.708 | 6.205 | 5.315 | 9.120 | 3.469 | 4.203 |
| 历史—基准趋近法 | 0.758 | 2.500 | 5.965 | 5.350 | 8.916 | 3.388 | 4.081 |
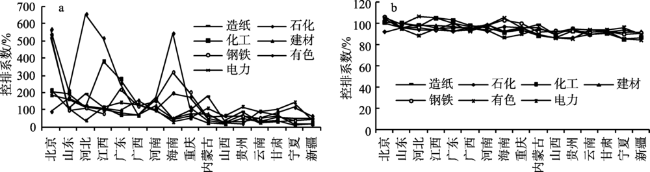
Figure 2 Comparison of control coefficients of carbon emissionsof benchmarking method (a) and grandfathering-benchmarking approaching method (b)图2 基准线法(a)和历史—基准趋近法(b)的控排系数对比 |
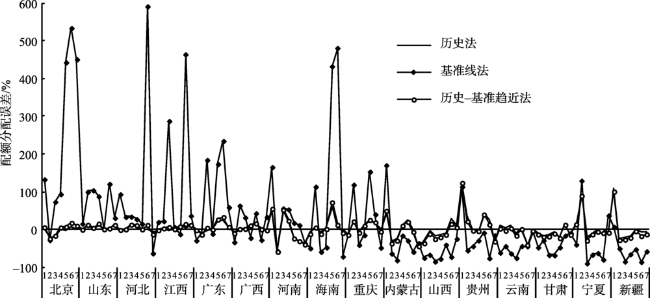
Figure 3 Comparison of allocation error ratios of three allowanceallocation methods图3 3种配额分配方法分配误差比例对比 |
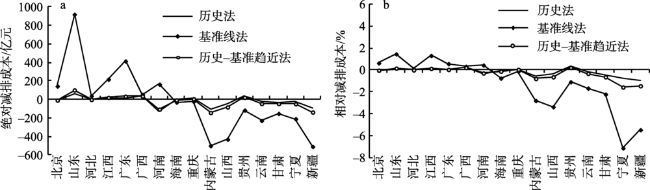
Figure 4 Comparison of absolute emission reduction costs (a) and relative emission reduction costs (b) of 16 regions图4 16个样本省域绝对减排成本(a)和相对减排成本(b)对比 |
The authors have declared that no competing interests exist.
| [1] |
[
|
| [2] |
|
| [3] |
[
|
| [4] |
[
|
| [5] |
[
|
| [6] |
[
|
| [7] |
[
|
| [8] |
|
| [9] |
[
|
| [10] |
|
| [11] |
[
|
| [12] |
|
| [13] |
[
|
| [14] |
|
| [15] |
|
| [16] |
[
|
| [17] |
[
|
| [18] |
[
|
| [19] |
[
|
| [20] |
|
| [21] |
[
|
| [22] |
|
| [23] |
[
|
| [24] |
中国能源网. 碳交易市场配额分配方案征集意见中, 电力行业预分配比例暂定70%[EB/OL]. (2017-06-02)[2018-03-06].
[China Energy Network. Quota Allocation Scheme of Carbon Trading Market In Soliciting Opinions, the Pre-allocation Proportion of Power Industry Is Tentatively Set at 70%[EB/OL]. (2017-06-02)[2018-03-06].
|
| [25] |
[
|
| [26] |
[
|
| [27] |
|
| [28] |
[
|
| [29] |
[
|
| [30] |
住房城乡建设部. 住房城乡建设部关于印发建筑业发展“十三五”规划的通知[EB/OL]. (2017-05-03)[2018-03-25].
[Ministry of Housing, Urban and Rural Development. Circular of the Ministry of Housing, Urban and Rural Construction on Issuing the 13th Five-Year Plan for the Development of Construction Industry[EB/OL]. (2017-05-03)[2018-03-25].
|
| [31] |
国务院. 国务院关于印发《中国制造2025》的通知[EB/OL]. (2015-05-19)[2018-03-27].
[State Council. Circular of the State Council on the Issuance of Made in China 2025[EB/OL]. (2015-05-19)[2018-03-27].
|
| [32] |
[
|
| [33] |
国务院. 国务院关于印发“十三五”控制温室气体排放工作方案的通知[EB/OL]. (2016-11-04)[2018-04-08].
[State Council. Circular of the State Council on the Issuance of the 13th Five-Year Plan of Work for the Control of Greenhouse Gas Emissions[EB/OL]. (2016-11-04)[2018-04-08].
|
/
| 〈 |
|
〉 |