
Temperature vegetation water index: A novel stabilized threshold method for lake surface water mapping
Received date: 2017-04-27
Request revised date: 2017-08-23
Online published: 2019-04-25
Copyright
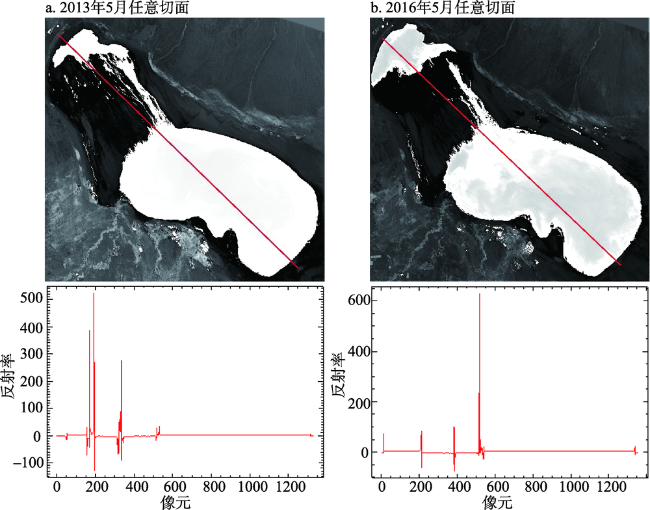
Considering that the traditional water indices have no exact threshold value to distinguish water body from other land cover types, in this study a novel method was proposed, in which the reflectance value “0” is used as a segmentation line to distinguish water body from other land cover types. Landsat 8 satellite data of Ebinur Lake, Bosten Lake, Poyang Lake, and Alakol Lake from different years were acquired and used to analyze the reflectance value and spectral and principal component space features of water and other land cover types. A novel water index named temperature vegetation water index (TVWI) was constructed. Maximum likelihood classification was used to extract water areas as the ground truth data. Compared with traditional water extraction indices, the results indicate that the overall TVWI water extraction accuracy in May 2013 and May 2016 is 98.51% and 97.33%, and Kappa coefficients are 0.97 and 0.95 correspondingly in Ebinur Lake. The overall TVWI water extraction accuracy in Bosten Lake is 99.66%, Poyang Lake is 98.06%, and Alakol Lake is 99.72%. The overall accuracy is better than the traditional methods, which implies that extracting water information by using TVWI method is feasible. In TVWI the reflectance value of 0 is the segmentation value to classify water and non-water areas. There are higher noise values at the lakefront but the values of water area are higher than 0, so there is a visible distinction between water and other land cover types. As a result, water information can be easily extracted by using the TVWI method. In conclusion, extracting Ebinur water information using the Landsat 8 satellite data from 29 May 2013 and 21 May 2016 yielded better result, and the overall accuracy and Kappa coefficient are the best compared with the three traditional water indices that we compared. The adaptation of TVWI to different lakes was analyzed and the accuracy of water extraction in different types of lake is higher than other methods.
ZHU Xiaoqiang , DING Jianli , XIA Nan , GUO Jiaxin , ZHANG Shuxia , YANG Tongtong , WANG Jingzhe , LI Xiaohang . Temperature vegetation water index: A novel stabilized threshold method for lake surface water mapping[J]. Resources Science, 2019 , 41(4) : 790 -802 . DOI: 10.18402/resci.2019.04.15
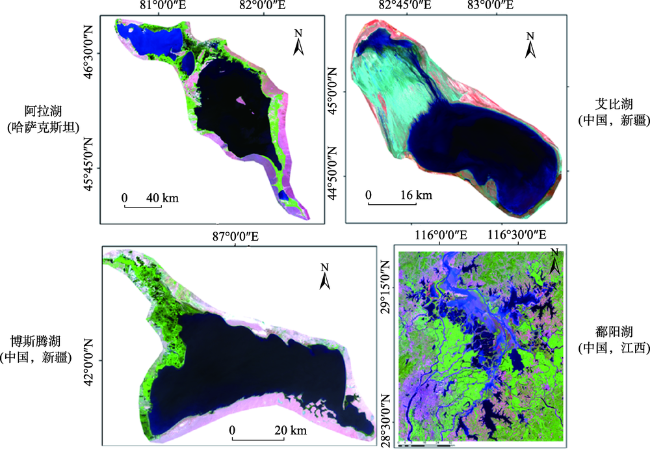
Figure 1 The study areas图1 研究区示意图 |
Table 1 Data used in the study表1 研究数据源 |
| 湖泊名称 | 国家 | 日期 | Landsat 8数据 | 地理环境 | |||
|---|---|---|---|---|---|---|---|
| 行列号 | 分辨率/m | 海拔/m | 湖泊类型 | ||||
| 艾比湖 | 中国 | 2013.5.29 | 146/29 | 30 | 189 | 平原区尾闾湖泊 | |
| 2016.5.21 | 146/29 | 30 | |||||
| 博斯腾湖 | 中国 | 2016.5.16 | 143/31 | 30 | 1 048 | 吞吐湖泊 | |
| 鄱阳湖 | 中国 | 2016.9.27 | 121/40 | 30 | 21 | 吞吐湖泊 | |
| 阿拉湖 | 哈萨克斯坦 | 2013.6.21 | 147/28 | 30 | 348 | 高山湖泊 | |
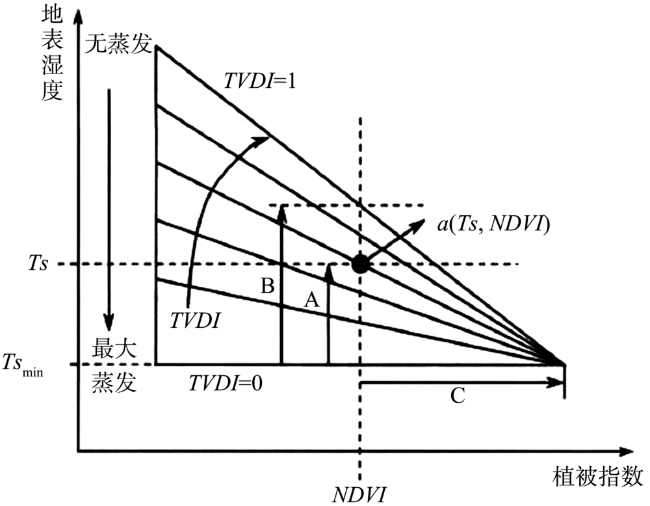
Figure 2 The principle of temperature vegetation dryness index (TVDI)图2 温度植被干旱指数(TVDI)原理示意图[20] |
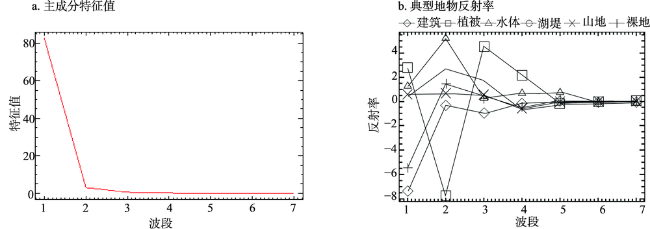
Figure 3 Principal component analysis of Landsat 8 Operational Land Imager (OLI) image and reflectivity characteristics of typical ground objects图3 Landsat 8 OLI图像主成分分析及典型地物反射率特征 |
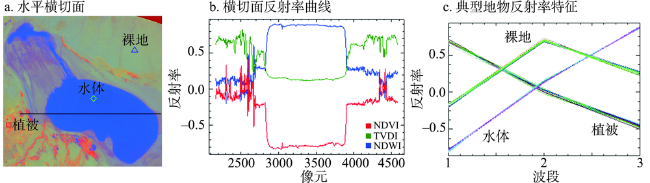
Figure 4 Reflectance of typical ground objects图4 横切面反射率分析 |
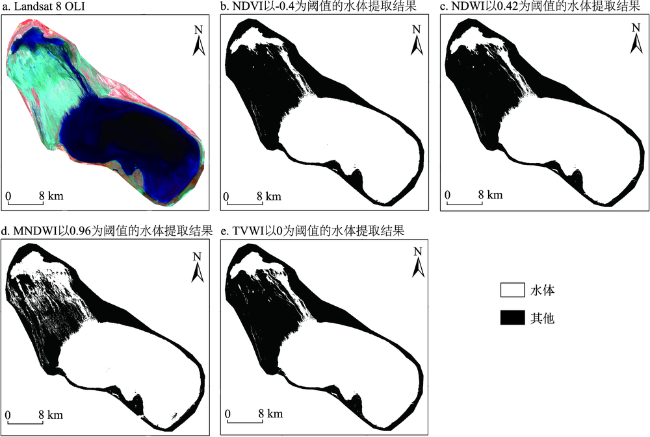
Figure 5 Water extraction results of each water index, 29 May 2013图5 2013年5月29日各类水体指数提取结果 |
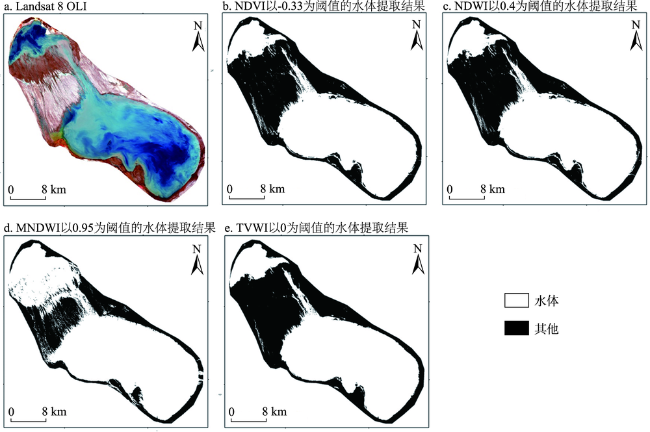
Figure 6 Water extraction results of each water index, 21 May 2016图6 2016年5月21日各类水体指数提取结果 |
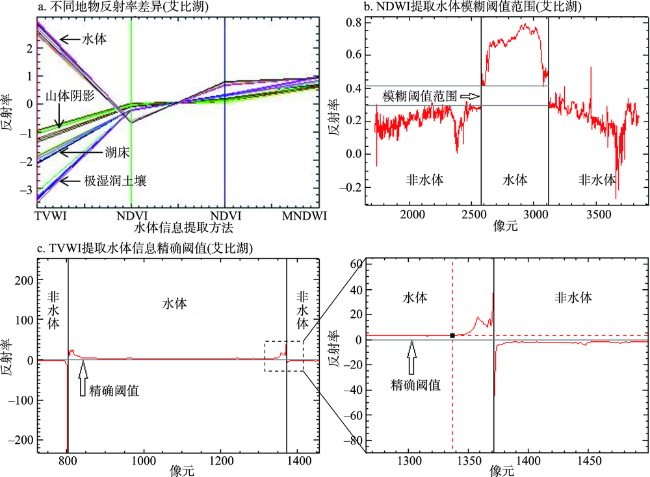
Figure 7 Threshold analysis for Ebinur Lake图7 艾比湖精确阈值分析 |
Table 2 Water extraction accuracy evaluation of each water index in 2013 and 2016, Ebinur Lake表2 艾比湖不同时相内各水体指数提取水体精度评价 |
| 方法 | 总体精度/% | Kappa系数 | 生产者精度/% | 用户精度/% | 错分/% | |||||||||
|---|---|---|---|---|---|---|---|---|---|---|---|---|---|---|
| 2013.5 | 2016.5 | 2013.5 | 2016.5 | 2013.5 | 2016.5 | 2013.5 | 2016.5 | 2013.5 | 2016.5 | |||||
| NDVI | 97.80 | 97.08 | 0.95 | 0.93 | 96.30 | 97.84 | 99.84 | 97.22 | 0.16 | 2.78 | ||||
| NDWI | 98.57 | 96.85 | 0.97 | 0.93 | 98.02 | 97.40 | 99.47 | 97.27 | 0.53 | 2.73 | ||||
| MNDWI | 94.41 | 85.71 | 0.88 | 0.69 | 99.73 | 99.96 | 91.26 | 80.48 | 8.74 | 19.52 | ||||
| TVWI | 98.51 | 97.33 | 0.97 | 0.95 | 98.82 | 97.19 | 98.57 | 98.25 | 1.43 | 1.75 | ||||
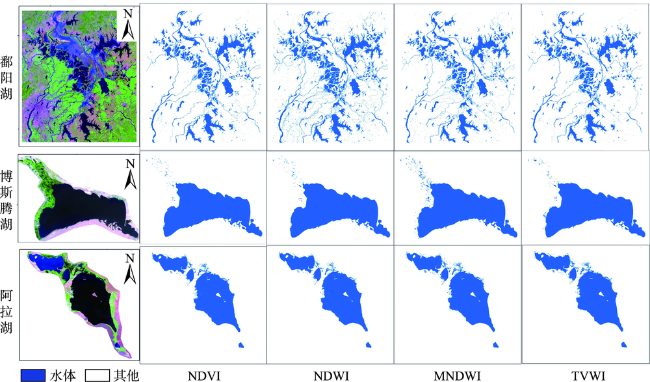
Figure 8 Comparison of water extraction in different lakes by different methods图8 不同方法提取水体信息对比 |
Table 3 Summary of accuracy assessments at the three lakes表3 不同类型湖泊的精度评价 |
| 湖泊名称 | 方法 | 阈值 | 总体精度% | Kappa系数 | 生产者精度/% | 用户精度% | 错分误差% | 漏分误差% |
|---|---|---|---|---|---|---|---|---|
| 鄱阳湖 | NDVI | -0.20 | 97.52 | 0.90 | 99.17 | 85.50 | 14.50 | 0.83 |
| -0.30 | 97.96 | 0.91 | 92.60 | 92.88 | 7.12 | 7.40 | ||
| -0.40 | 95.80 | 0.81 | 72.17 | 97.21 | 2.79 | 27.83 | ||
| NDWI | 0.10 | 85.70 | 0.58 | 100.00 | 49.55 | 50.45 | 0.00 | |
| 0.20 | 92.99 | 0.76 | 100.00 | 66.71 | 33.29 | 0.00 | ||
| 0.30 | 96.65 | 0.87 | 99.92 | 80.80 | 19.20 | 0.08 | ||
| MNDWI | 0.90 | 97.20 | 0.89 | 100.00 | 83.38 | 16.62 | 0.00 | |
| 0.93 | 98.34 | 0.93 | 100.00 | 89.46 | 10.54 | 0.00 | ||
| 0.95 | 99.25 | 0.97 | 98.74 | 96.04 | 3.96 | 1.26 | ||
| TVWI | -0.50 | 93.53 | 0.76 | 93.04 | 70.39 | 29.61 | 6.96 | |
| 0.00 | 98.06 | 0.92 | 93.04 | 93.16 | 6.84 | 6.96 | ||
| 0.50 | 98.06 | 0.92 | 93.04 | 93.20 | 6.80 | 6.96 | ||
| 博斯腾湖 | NDVI | -0.20 | 99.68 | 0.99 | 99.83 | 98.99 | 1.01 | 0.17 |
| -0.25 | 99.75 | 0.99 | 99.34 | 99.69 | 0.31 | 0.66 | ||
| -0.30 | 99.35 | 0.98 | 97.61 | 99.93 | 0.07 | 2.39 | ||
| NDWI | 0.40 | 99.46 | 0.98 | 99.19 | 99.90 | 0.10 | 0.81 | |
| 0.43 | 99.03 | 0.98 | 98.45 | 99.92 | 0.06 | 1.30 | ||
| 0.45 | 98.63 | 0.97 | 97.69 | 99.97 | 0.03 | 2.31 | ||
| MNDWI | 0.80 | 97.96 | 0.95 | 100.00 | 96.63 | 3.37 | 0.00 | |
| 0.83 | 98.90 | 0.97 | 99.84 | 98.32 | 1.68 | 0.16 | ||
| 0.85 | 98.89 | 0.97 | 98.93 | 99.17 | 0.83 | 1.07 | ||
| TVWI | 0.00 | 99.75 | 0.99 | 99.27 | 99.78 | 0.22 | 0.73 | |
| 0.30 | 99.74 | 0.99 | 99.27 | 99.76 | 0.27 | 0.73 | ||
| 0.45 | 99.66 | 0.99 | 99.27 | 99.44 | 0.56 | 0.73 | ||
| 阿拉湖 | NDVI | -0.28 | 99.81 | 0.99 | 100.00 | 99.03 | 0.97 | 0.00 |
| -0.32 | 99.85 | 0.99 | 100.00 | 99.24 | 0.76 | 0.00 | ||
| -0.35 | 99.84 | 0.99 | 99.81 | 99.39 | 0.61 | 0.19 | ||
| NDWI | 0.55 | 99.64 | 0.99 | 99.99 | 99.38 | 0.62 | 0.01 | |
| 0.58 | 99.72 | 0.99 | 99.97 | 99.53 | 0.47 | 0.03 | ||
| 0.60 | 99.75 | 0.99 | 99.92 | 99.63 | 0.37 | 0.08 | ||
| MNDWI | 0.85 | 98.45 | 0.96 | 100.00 | 97.30 | 2.70 | 0.00 | |
| 0.87 | 98.73 | 0.97 | 100.00 | 97.78 | 2.22 | 0.00 | ||
| 0.90 | 99.10 | 0.98 | 99.98 | 98.43 | 1.57 | 0.02 | ||
| TVWI | -0.10 | 99.71 | 0.99 | 100.00 | 98.55 | 1.45 | 0.00 | |
| 0.00 | 99.72 | 0.99 | 100.00 | 98.56 | 1.44 | 0.00 | ||
| 0.1 | 99.72 | 0.99 | 100 | 98.56 | 1.44 | 0 |
Figure 9 A randomly selected profile of temperature vegetation water index (TVWI) in May 2013 and May 2016图9 不同时相的TVWI任意切面 |
The authors have declared that no competing interests exist.
| [1] |
|
| [2] |
[
|
| [3] |
[
|
| [4] |
[
|
| [5] |
[
|
| [6] |
[
|
| [7] |
|
| [8] |
[
|
| [9] |
[
|
| [10] |
[
|
| [11] |
[
|
| [12] |
[
|
| [13] |
|
| [14] |
[
|
| [15] |
[
|
| [16] |
|
| [17] |
[
|
| [18] |
[
|
| [19] |
|
| [20] |
[
|
| [21] |
[
|
| [22] |
[
|
| [23] |
|
| [24] |
|
| [25] |
|
| [26] |
[
|
| [27] |
[
|
| [28] |
|
| [29] |
|
/
| 〈 |
|
〉 |