
Received date: 2018-11-23
Request revised date: 2018-12-12
Online published: 2019-04-25
Copyright
Water resource security risk assessment is an important foundation of water resource risk management. In this paper, based on the definition of water resource security, we combine disaster system theory and risk theory to construct the risk assessment index system of water resources security and the risk assessment model of water resource security. The subjective AHP (Analytic Hierarchy Process) method and objective entropy weight method combined with the optimal combination of deviation square sum weighting method were proposed to determine the index comprehensive weight. And then, the risk level of water resource security of each province was calculated by coupling the above methods and combining with relevant data indexes which were obtained in China’s statistical yearbook, each provincial water resources bulletin and some water resources security research results in recent years. And extreme high risk level, high risk level, moderate risk level, low risk level and extreme low risk level of water resources security risk were calculated through the natural break classification method. Finally, the types of water resource security risks in each research unit with extreme high risk level, high risk level, and moderate risk level were calcounted based on hazard indicators. The water resources security risk statistical results show that the risk of water resources shortage is identified in Beijing, Tianjin, Hebei, Liaoning, Shandong, Henan, Ningxia, and Gansu provinces. Risk of water quality is found in Shanghai, Liaoning, Beijing, Tianjin, Hebei, Jiangsu, Jilin, Shanxi, Henan, and Guangxi provinces. Drought risks is characterized in Heilongjiang, Shanxi, Gansu, Hainan, Xinjiang, Inner Mongolia and Ningxia provinces. Flood risk is exhibited in Guangdong and Fujian provinces. Through different risk types of water resources security some risk preventive and controllable measures are proposed to manage China’s water resources security scientifically to remit and solve the water resources security risk level of each research unit.
LIANG Yuanyi , LV Aifeng . Risk assessment of water resource security in China[J]. Resources Science, 2019 , 41(4) : 775 -789 . DOI: 10.18402/resci.2019.04.14
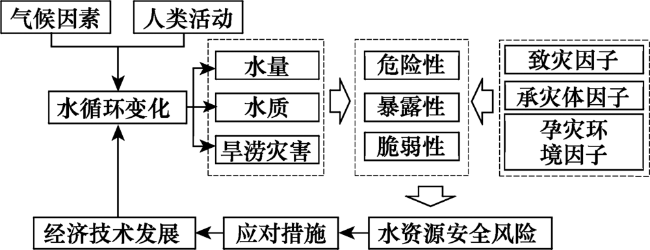
Figure 1 Process of water resources security risk assessment图1 水资源安全风险分析流程 |
Table 1 Water resources security risk indexes system表1 水资源安全风险评价指标体系 |
| 目标层 | 风险属性层 | 评价指标层 |
|---|---|---|
| WR水 | H危险性 | H1人均可利用水资源量/(m3/人) |
| 资源风险 | H2降雨变差系数 | |
| H3万元GDP排污强度/(m3/万元) | ||
| H4干旱强度(SPI) | ||
| E暴露性 | E1人口密度/(人/km2) | |
| E2人均GDP/(元/人) | ||
| E3农林牧渔总产值与地区生产总值之比/% | ||
| V脆弱性 | V1干旱损失与GDP之比/% | |
| V2洪涝损失与GDP之比/% | ||
| V3水费占总生产成本之比/% | ||
| V4水资源开发利用率/% | ||
| V5生态用水满足度/% | ||
| V6万元工业增加值用水量/(m3/万元) | ||
| V7三类以下水质河长占总河长比/% | ||
| V8水利投资占GDP之比/% | ||
| V9污水处理率/% | ||
| V10是否存在跨流域调水 |
Table 2 Division of drought grades and probability grades表2 干旱等级以及概率等级划分[33] |
| 干旱等级 | SPI数值 | 定量干旱等级 | 概率/% | 概率等级 |
|---|---|---|---|---|
| 轻微干旱 | 0 ~ -0.99 | 1 | <30.0 | 1 |
| 30.0~33.0 | 2 | |||
| 33.0~35.0 | 3 | |||
| >35.0 | 4 | |||
| 中等干旱 | -1.00 ~ -1.49 | 2 | <9.0 | 1 |
| 9.0~10.0 | 2 | |||
| 10.0~11.0 | 3 | |||
| >11.0 | 4 | |||
| 严重干旱 | -1.50 ~ -1.99 | 3 | <3.5 | 1 |
| 3.5~4.5 | 2 | |||
| 4.5~5.5 | 3 | |||
| >5.5 | 4 | |||
| 极其严重干旱 | ≤ -2.0 | 4 | <1.5 | 1 |
| 1.5~2.0 | 2 | |||
| 2.0~2.5 | 3 | |||
| >2.5 | 4 |
Table 3 Subjective and objective weight of water resources security risk indexes system (W1 and W2)表3 水资源安全风险评价指标主客观权重W1和W2 |
| 指标 | W1 | W2 | 指标 | W1 | W2 |
|---|---|---|---|---|---|
| H1 | 0.600 | 0.254 | V3 | 0.033 | 0.099 |
| H2 | 0.100 | 0.250 | V4 | 0.192 | 0.099 |
| H3 | 0.100 | 0.252 | V5 | 0.192 | 0.097 |
| H4 | 0.200 | 0.244 | V6 | 0.099 | 0.102 |
| E1 | 0.200 | 0.323 | V7 | 0.099 | 0.099 |
| E2 | 0.200 | 0.337 | V8 | 0.099 | 0.105 |
| E3 | 0.600 | 0.340 | V9 | 0.033 | 0.103 |
| V1 | 0.099 | 0.094 | V10 | 0.053 | 0.103 |
| V2 | 0.099 | 0.099 |
Table 4 Comprehensive weight of water resources security risk indexes system (W)表4 水资源安全风险评价指标综合权重W |
| 指标 | W | 指标 | W |
|---|---|---|---|
| H1 | 0.459 | V3 | 0.061 |
| H2 | 0.163 | V4 | 0.152 |
| H3 | 0.163 | V5 | 0.154 |
| H4 | 0.215 | V6 | 0.100 |
| E1 | 0.233 | V7 | 0.099 |
| E2 | 0.240 | V8 | 0.101 |
| E3 | 0.527 | V9 | 0.063 |
| V1 | 0.097 | V10 | 0.074 |
| V2 | 0.099 |
Table 5 Grades of hazard and contribution of hazard indexes for each province of China in 2015表5 2015年中国各省现状水资源危险性以及危险性指标贡献大小 |
| 等级 | 省份 | H | H1 | H2 | H3 | H4 | 等级 | 省份 | H | H1 | H2 | H3 | H4 |
|---|---|---|---|---|---|---|---|---|---|---|---|---|---|
| 极高 | 晋 | 0.728 | 0.853 | 0.523 | 0.745 | 0.333 | 低 | 皖 | 0.409 | 0.240 | 0.420 | 0.923 | 0.667 |
| 冀 | 0.704 | 0.889 | 0.641 | 0.621 | 0.000 | 吉 | 0.404 | 0.455 | 0.370 | 0.440 | 0.167 | ||
| 鲁 | 0.699 | 0.826 | 0.591 | 0.422 | 0.500 | 云 | 0.395 | 0.182 | 0.411 | 0.920 | 0.833 | ||
| 豫 | 0.693 | 0.766 | 0.288 | 0.789 | 0.667 | 浙 | 0.394 | 0.416 | 0.000 | 0.582 | 0.500 | ||
| 津 | 0.683 | 1.000 | 0.587 | 0.000 | 0.000 | 闽 | 0.384 | 0.308 | 0.284 | 0.552 | 0.667 | ||
| 京 | 0.668 | 0.981 | 0.434 | 0.125 | 0.000 | 赣 | 0.381 | 0.274 | 0.136 | 1.000 | 0.500 | ||
| 高 | 宁 | 0.569 | 0.538 | 0.988 | 0.696 | 0.167 | 桂 | 0.380 | 0.231 | 0.193 | 0.967 | 0.667 | |
| 辽 | 0.533 | 0.634 | 0.350 | 0.446 | 0.333 | 渝 | 0.364 | 0.217 | 0.431 | 0.506 | 0.833 | ||
| 陕 | 0.531 | 0.540 | 0.237 | 0.480 | 0.833 | 湘 | 0.356 | 0.293 | 0.014 | 0.679 | 0.667 | ||
| 甘 | 0.528 | 0.537 | 0.488 | 0.551 | 0.500 | 蒙 | 0.356 | 0.372 | 0.586 | 0.077 | 0.333 | ||
| 粤 | 0.503 | 0.391 | 0.633 | 0.893 | 0.500 | 鄂 | 0.338 | 0.255 | 0.081 | 0.647 | 0.667 | ||
| 中 | 贵 | 0.447 | 0.285 | 0.426 | 0.662 | 1.000 | 新 | 0.313 | 0.248 | 0.076 | 0.660 | 0.500 | |
| 琼 | 0.445 | 0.289 | 0.415 | 0.640 | 1.000 | 极低 | 沪 | 0.267 | 0.060 | 0.325 | 0.427 | 1.000 | |
| 川 | 0.441 | 0.283 | 0.807 | 0.743 | 0.500 | 藏 | 0.220 | 0.000 | 1.000 | 0.014 | 0.667 | ||
| 苏 | 0.438 | 0.330 | 0.725 | 0.419 | 0.667 | 青 | 0.161 | 0.000 | 0.517 | 0.539 | 0.167 | ||
| 黑 | 0.431 | 0.330 | 0.545 | 0.547 | 0.667 |
Table 6 Grades of exposure and contribution of exposure indexes for each province of China in 2015表6 2015年中国各省现状水资源安全暴露性以及各暴露性指标贡献大小 |
| 等级 | 省 | E | E1 | E2 | E3 | 等级 | 省 | E | E1 | E2 | E3 |
|---|---|---|---|---|---|---|---|---|---|---|---|
| 极高 | 沪 | 0.613 | 1.000 | 0.949 | 0.000 | 低 | 贵 | 0.296 | 0.052 | 0.045 | 0.720 |
| 津 | 0.475 | 0.343 | 1.000 | 0.047 | 粤 | 0.295 | 0.157 | 0.505 | 0.185 | ||
| 京 | 0.456 | 0.345 | 0.982 | 0.011 | 冀 | 0.292 | 0.103 | 0.172 | 0.546 | ||
| 琼 | 0.453 | 0.069 | 0.179 | 1.000 | 湘 | 0.291 | 0.083 | 0.203 | 0.529 | ||
| 高 | 苏 | 0.425 | 0.202 | 0.756 | 0.255 | 皖 | 0.274 | 0.114 | 0.120 | 0.543 | |
| 黑 | 0.417 | 0.049 | 0.163 | 0.933 | 川 | 0.273 | 0.044 | 0.130 | 0.579 | ||
| 辽 | 0.410 | 0.273 | 0.479 | 0.438 | 云 | 0.272 | 0.032 | 0.032 | 0.684 | ||
| 新 | 0.371 | 0.003 | 0.170 | 0.836 | 陕 | 0.263 | 0.047 | 0.262 | 0.417 | ||
| 鲁 | 0.364 | 0.166 | 0.465 | 0.404 | 甘 | 0.262 | 0.014 | 0.000 | 0.699 | ||
| 蒙 | 0.355 | 0.005 | 0.549 | 0.412 | 宁 | 0.250 | 0.026 | 0.216 | 0.445 | ||
| 吉 | 0.354 | 0.139 | 0.305 | 0.558 | 渝 | 0.248 | 0.095 | 0.320 | 0.285 | ||
| 闽 | 0.349 | 0.082 | 0.511 | 0.379 | 赣 | 0.236 | 0.071 | 0.129 | 0.460 | ||
| 中 | 浙 | 0.329 | 0.141 | 0.629 | 0.163 | 极低 | 青 | 0.196 | 0.001 | 0.184 | 0.347 |
| 鄂 | 0.326 | 0.081 | 0.299 | 0.526 | 晋 | 0.170 | 0.061 | 0.107 | 0.310 | ||
| 桂 | 0.308 | 0.052 | 0.110 | 0.688 | 藏 | 0.169 | 0.000 | 0.071 | 0.387 | ||
| 豫 | 0.305 | 0.147 | 0.158 | 0.563 |
Table 7 Grades of vulnerability and contribution of vulnerability indexes foreach province of China in 2015表7 2015年中国各省现状水资源安全脆弱性以及各脆弱性指标贡献大小 |
| 等级 | 省份 | V | V1 | V2 | V3 | V4 | V5 | V6 | V7 | V8 | V9 | V10 |
|---|---|---|---|---|---|---|---|---|---|---|---|---|
| 极高 | 津 | 0.596 | 0.919 | 0.000 | 0.333 | 1.000 | 1.000 | 0.000 | 1.000 | 0.603 | 0.206 | 0.000 |
| 冀 | 0.522 | 0.615 | 0.013 | 0.333 | 0.691 | 1.000 | 0.123 | 0.622 | 0.732 | 0.465 | 0.000 | |
| 京 | 0.504 | 0.000 | 0.008 | 1.000 | 0.712 | 1.000 | 0.033 | 0.535 | 0.976 | 0.356 | 0.000 | |
| 高 | 辽 | 0.480 | 1.000 | 0.001 | 0.167 | 0.390 | 0.178 | 0.118 | 0.936 | 0.740 | 0.554 | 1.000 |
| 甘 | 0.475 | 0.300 | 0.152 | 0.333 | 0.296 | 0.667 | 0.714 | 0.335 | 0.549 | 0.473 | 1.000 | |
| 沪 | 0.460 | 0.000 | 0.013 | 0.500 | 0.596 | 0.000 | 0.564 | 0.937 | 1.000 | 0.230 | 1.000 | |
| 晋 | 0.456 | 0.750 | 0.088 | 0.333 | 0.389 | 0.444 | 0.216 | 0.615 | 0.483 | 0.356 | 1.000 | |
| 新 | 0.440 | 0.203 | 0.344 | 0.333 | 0.311 | 0.778 | 0.441 | 0.032 | 0.538 | 0.376 | 1.000 | |
| 宁 | 0.434 | 0.416 | 0.131 | 0.333 | 0.397 | 0.667 | 0.390 | 0.000 | 0.644 | 0.312 | 1.000 | |
| 闽 | 0.428 | 0.042 | 1.000 | 0.333 | 0.072 | 0.333 | 0.726 | 0.221 | 0.595 | 0.271 | 1.000 | |
| 鲁 | 0.426 | 0.530 | 0.016 | 0.500 | 0.629 | 0.444 | 0.047 | 0.566 | 0.912 | 0.372 | 0.000 | |
| 蒙 | 0.421 | 0.829 | 0.041 | 0.333 | 0.169 | 0.444 | 0.199 | 0.401 | 0.611 | 0.473 | 1.000 | |
| 中 | 粤 | 0.398 | 0.209 | 0.439 | 0.500 | 0.111 | 0.333 | 0.365 | 0.248 | 0.929 | 0.149 | 1.000 |
| 青 | 0.391 | 0.180 | 0.215 | 0.333 | 0.019 | 0.667 | 0.328 | 0.037 | 0.619 | 0.919 | 1.000 | |
| 赣 | 0.383 | 0.064 | 0.455 | 0.000 | 0.058 | 0.333 | 1.000 | 0.078 | 0.603 | 0.514 | 1.000 | |
| 桂 | 0.377 | 0.114 | 0.331 | 0.333 | 0.058 | 0.333 | 1.000 | 0.076 | 0.566 | 0.271 | 1.000 | |
| 黑 | 0.376 | 0.072 | 0.084 | 0.167 | 0.215 | 0.111 | 0.637 | 0.440 | 0.796 | 0.676 | 1.000 | |
| 低 | 陕 | 0.352 | 0.158 | 0.111 | 0.333 | 0.133 | 0.667 | 0.104 | 0.330 | 0.339 | 0.546 | 1.000 |
| 吉 | 0.352 | 0.300 | 0.019 | 0.167 | 0.198 | 0.111 | 0.352 | 0.432 | 0.769 | 0.595 | 1.000 | |
| 云 | 0.345 | 0.309 | 0.412 | 0.000 | 0.075 | 0.111 | 0.726 | 0.144 | 0.565 | 0.494 | 1.000 | |
| 豫 | 0.343 | 0.003 | 0.036 | 0.333 | 0.385 | 0.444 | 0.237 | 0.622 | 0.728 | 0.514 | 0.000 | |
| 苏 | 0.341 | 0.006 | 0.235 | 0.167 | 0.393 | 0.000 | 0.110 | 0.733 | 0.825 | 0.113 | 1.000 | |
| 藏 | 0.330 | 0.000 | 0.143 | 0.167 | 0.000 | 0.556 | 0.465 | 0.000 | 0.415 | 1.000 | 1.000 | |
| 琼 | 0.328 | 0.027 | 0.385 | 0.000 | 0.112 | 0.000 | 0.735 | 0.064 | 0.776 | 0.668 | 1.000 | |
| 鄂 | 0.320 | 0.056 | 0.217 | 0.000 | 0.145 | 0.000 | 0.913 | 0.209 | 0.648 | 0.352 | 1.000 | |
| 湘 | 0.302 | 0.021 | 0.396 | 0.000 | 0.082 | 0.000 | 0.925 | 0.022 | 0.527 | 0.479 | 1.000 | |
| 浙 | 0.298 | 0.000 | 0.580 | 0.167 | 0.062 | 0.000 | 0.268 | 0.320 | 0.743 | 0.267 | 1.000 | |
| 皖 | 0.289 | 0.000 | 0.526 | 0.167 | 0.154 | 0.000 | 0.462 | 0.200 | 0.648 | 0.000 | 1.000 | |
| 极低 | 川 | 0.253 | 0.074 | 0.411 | 0.000 | 0.056 | 0.000 | 0.515 | 0.000 | 0.568 | 0.271 | 1.000 |
| 贵 | 0.238 | 0.000 | 0.575 | 0.000 | 0.038 | 0.000 | 0.739 | 0.116 | 0.000 | 0.299 | 1.000 | |
| 渝 | 0.232 | 0.016 | 0.160 | 0.000 | 0.083 | 0.000 | 0.639 | 0.000 | 0.499 | 0.271 | 1.000 |
Table 8 Grades of water resources security risk and contribution of risk attributions for each province of China in 2015表8 2015年中国各省现状水资源安全风险值和风险属性贡献大小 |
| 等级 | 省份 | H | E | V | R | 等级 | 省份 | H | E | V | R |
|---|---|---|---|---|---|---|---|---|---|---|---|
| 极高 | 津 | 0.683 | 0.475 | 0.596 | 0.194 | 中 | 新 | 0.313 | 0.371 | 0.440 | 0.051 |
| 京 | 0.668 | 0.456 | 0.504 | 0.154 | 吉 | 0.404 | 0.354 | 0.352 | 0.050 | ||
| 鲁 | 0.699 | 0.364 | 0.426 | 0.108 | 陕 | 0.531 | 0.263 | 0.352 | 0.049 | ||
| 冀 | 0.704 | 0.292 | 0.522 | 0.107 | 桂 | 0.380 | 0.308 | 0.377 | 0.044 | ||
| 辽 | 0.533 | 0.410 | 0.480 | 0.105 | 低 | 浙 | 0.394 | 0.329 | 0.298 | 0.039 | |
| 高 | 沪 | 0.267 | 0.613 | 0.460 | 0.075 | 云 | 0.395 | 0.272 | 0.345 | 0.037 | |
| 豫 | 0.693 | 0.305 | 0.343 | 0.072 | 鄂 | 0.338 | 0.326 | 0.320 | 0.035 | ||
| 黑 | 0.431 | 0.417 | 0.376 | 0.067 | 赣 | 0.381 | 0.236 | 0.383 | 0.034 | ||
| 琼 | 0.445 | 0.453 | 0.328 | 0.066 | 皖 | 0.409 | 0.274 | 0.289 | 0.032 | ||
| 甘 | 0.528 | 0.262 | 0.475 | 0.065 | 湘 | 0.356 | 0.291 | 0.302 | 0.031 | ||
| 苏 | 0.438 | 0.425 | 0.341 | 0.063 | 贵 | 0.447 | 0.296 | 0.238 | 0.031 | ||
| 宁 | 0.569 | 0.250 | 0.434 | 0.062 | 川 | 0.441 | 0.273 | 0.253 | 0.030 | ||
| 中 | 粤 | 0.503 | 0.295 | 0.398 | 0.059 | 极低 | 渝 | 0.364 | 0.248 | 0.232 | 0.021 |
| 闽 | 0.384 | 0.349 | 0.428 | 0.057 | 青 | 0.161 | 0.196 | 0.391 | 0.012 | ||
| 晋 | 0.728 | 0.170 | 0.456 | 0.056 | 藏 | 0.220 | 0.169 | 0.330 | 0.012 | ||
| 蒙 | 0.356 | 0.355 | 0.421 | 0.053 |
The authors have declared that no competing interests exist.
| [1] |
|
| [2] |
|
| [3] |
|
| [4] |
|
| [5] |
|
| [6] |
[
|
| [7] |
|
| [8] |
|
| [9] |
[
|
| [10] |
|
| [11] |
|
| [12] |
[
|
| [13] |
|
| [14] |
|
| [15] |
[
|
| [16] |
[
|
| [17] |
[
|
| [18] |
[
|
| [19] |
|
| [20] |
|
| [21] |
[
|
| [22] |
[
|
| [23] |
|
| [24] |
[
|
| [25] |
[
|
| [26] |
|
| [27] |
|
| [28] |
[
|
| [29] |
|
| [30] |
[
|
| [31] |
|
| [32] |
|
| [33] |
|
| [34] |
[
|
| [35] |
|
| [36] |
|
| [37] |
[
|
| [38] |
中华人民共和国水利部. 中国水资源公报2016[M]. 北京: 中国水利水电出版社, 2017.
[Ministry of Water Resources of the People’s Republic of China. Chinese Water Resources Bulletin 2016[M]. Beijing: China Water Power Press, 2017.]
|
| [39] |
中华人民共和国国家统计局. 中国统计年鉴2016[M]. 北京: 中国统计出版社, 2016.
[National Bureau of Statistics of the People’s Republic of China. China Statistical Yearbook 2016[M]. Beijing: China Statistics Press, 2016.]
|
| [40] |
中华人民共和国国家统计局. 中国环境统计年鉴2016[M]. 北京: 中国环境科学出版社, 2016.
[National Bureau of Statistics of the People’s Republic of China. China Environmental Statistics Yearbook 2016[M]. Beijing: China Environmental Science Press, 2016.]
|
| [41] |
中华人民共和国国家统计局. 国民经济和社会发展统计公报2016[M]. 北京: 中国统计出版社, 2016.
[National Bureau of Statistics of the People’s Republic of China. Statistical Bulletin on National Economic and Social Development 2016[M]. Beijing: China Environmental Science Press, 2016.]
|
| [42] |
[
|
| [43] |
|
| [44] |
[
|
| [45] |
[
|
| [46] |
[
|
/
| 〈 |
|
〉 |