
A study on the consistency and influencing factors of China’s provincial energy saving and environmental protection
Received date: 2018-05-09
Request revised date: 2018-09-21
Online published: 2018-12-10
Copyright
Energy conservation and environmental protection are two basic footholds for practicing the concept of green development of China. Whether the two can be coordinated is related to the sustainable development of China's economy. Incorporated the clean structure of energy consumption into the non-radial directional distance function (NDDF) which based on environmental technology, and used it to measure the energy saving efficiency, environmental protection efficiency, energy saving and environmental protection efficiency of total factors, and judged the realization of the consistency of inter-provincial energy conservation and environmental protection in China from 2001 to 2016 according to the calculation results. Found that if the clean structure of energy consumption is not considered, it will lead to the underestimation of the above-mentioned DEA total factor efficiency value. It is also found that the phenomenon of energy saving and environmental imbalance is more common than high energy consumption and high pollution. Probit model regression results show that the direction and intensity of the impact of fiscal energy conservation and environmental protection expenditure on energy conservation and environmental protection consistency depends on the level of economic development. On the contrary, the improvement of economic development level and the enhancement of environmental regulation have a negative impact on the realization of energy conservation and environmental protection consistency. The former suggests the existence of the phenomenon that sacrificing resources and environment to exchange for economic growth, while the latter illustrates that the Potter effect of “appropriate environmental regulation can stimulate technological innovation” has not yet appeared in China. The level of openness has a negative impact on achieving energy conservation and environmental coherence. Although this negative impact is small, it is enough to warn of the existence of “pollution paradise” risk.
LIU Haiying , SHANG Jing , WANG Dianwu . A study on the consistency and influencing factors of China’s provincial energy saving and environmental protection[J]. Resources Science, 2018 , 40(12) : 2438 -2450 . DOI: 10.18402/resci.2018.12.11
Table 1 Descriptive statistics of provincial energy conservation and environmental protection indicators in China from 2001 to 2016(base period 2001)表1 2001—2016年中国省际节能、环保指标的描述统计(2001年为基期) |
| 描述统计量/单位 | 最大值 | 最小值 | 均值 | 样本标准差 |
|---|---|---|---|---|
| 单位产值能耗/(tce/万元) | 5.01 | 0.49 | 1.62 | 0.790 |
| 单位产值非清洁化能耗/(tce/万元) | 4.09 | 0.26 | 0.98 | 0.550 |
| 单位产值清洁化能耗/(tce/万元) | 1.16 | 0.10 | 0.21 | 0.040 |
| 单位产值COD排放量/(t/亿元) | 554.24 | 9.40 | 61.52 | 0.340 |
| 单位产值氨氮排放量/(t/亿元) | 33.04 | 1.24 | 6.20 | 0.002 |
| 单位产值SO2排放量/(t/亿元) | 1 071.66 | 5.60 | 79.04 | 2.180 |
| 单位产值烟(粉)尘排放量/(t/亿元) | 735.90 | 4.08 | 59.74 | 1.430 |
Table 2 Variable selection that affects the consistency of energy conservation and environmental protection表2 影响节能与环保实现一致的变量选择 |
| 变量属性 | 变量代码 | 变量名称 | 变量含义/单位 |
|---|---|---|---|
| 解释变量 | Z1 | 政府对节能环保的管理力度 | 财政预算支出中节能环保支出所占比重/% |
| Z2 | 政府对工业污染的规制强度[25] | 工业污染治理投资占GDP比重/% | |
| Z3 | 能源消费强度 | 单位GDP能源消费量/(tce/万元) | |
| 控制变量 | X1 | 经济发展水平[21,22,26-28] | 不变价格的人均GDP的对数 |
| X2 | 产业结构[7,29,30] | 第三产业增加值占地区GDP份额/% | |
| X3 | 产权结构[22,31] | 国有控股工业总产值占工业总产值比重/% | |
| X4 | 工业结构 | 高耗能高污染行业总产值占工业总产值比重/% | |
| X5 | 城市化率[32] | 城镇人口占总人口比重/% | |
| X6 | 科技基础条件 | 单位R&D人员占有研发经费/(万元/人) | |
| X7 | 国内自主研发能力 | 国内发明专利申请授权量/% | |
| X8 | 科技占有量规模 | 技术市场成交额占销售产值比重/% | |
| X9 | 外资利用水平 | 外商直接投资与GDP之比/% | |
| X10 | 出口贸易 | 出口总额与GDP之比/% | |
| X11 | 进口贸易 | 进口总额与GDP之比/% |
Table 3 Additional provinces which energy efficiency or environmental efficiency is effective in the context of considering the clean structure of energy consumption (years)表3 考虑能源消费的清洁化结构情形下,新增的节能效率或环保效率有效的省份(年份) |
| 类别 | 考虑能源消费的清洁化结构情形下,新增的效率有效的省份(年份) |
|---|---|
| 节能效率 (25省次) | 辽宁(2010—2012年);吉林(2002年,2011年,2014年,2016年);江苏(2005年);浙江(2008年,2011年);安徽(2003年);江西(2002—2003年);山东(2002—2010年,2014年);广西(2011年);陕西(2003年) |
| 环保效率 (45省次) | 天津(2011—2015年);吉林(2011—2016年);黑龙江(2009—2016年);江苏(2001年);安徽(2004年);福建(2005—2009年);江西(2001年,2003年,2005—2010年);湖南(2005年,2008—2009年,2011—2016年);海南(2011—2012年) |
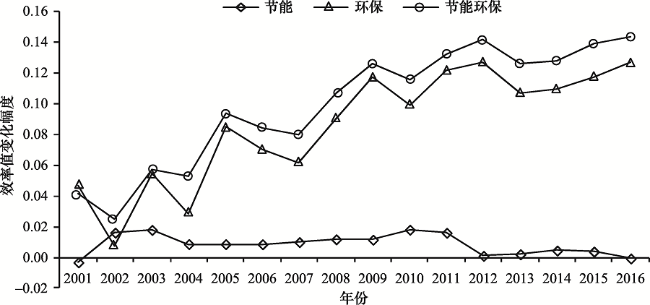
Figure 1 The increase rates of total factor efficiency under consideration of the clean structure of energy consumption in China from 2001 to 2016图1 2001—2016年中国考虑能源消费的清洁化结构情形下全要素效率提升幅度 |
Table 4 Province statistics with energy conservation and environmental protection consistency in China in the two contexts of whether considering the clean structure of energy consumption from 2001 to 2016表4 2001—2016年是否考虑能源消费的清洁化结构两种情形下中国具有节能与环保一致性的省份统计 |
| 年份 | 节能与环保一致的省份 | 年份 | 节能与环保一致的省份 |
|---|---|---|---|
| 2001 | 北京、上海、福建、广东、海南、江苏、江西 | 2009 | 北京、天津、上海、广东、海南、黑龙江、福建、江西、湖南 |
| 2002 | 北京、上海、福建、广东、海南 | 2010 | 北京、上海、广东、海南、黑龙江、江西 |
| 2003 | 北京、上海、福建、广东、海南、江西 | 2011 | 北京、上海、广东、天津、吉林、黑龙江、湖南、海南 |
| 2004 | 北京、上海、福建、广东、海南、安徽 | 2012 | 北京、上海、广东、天津、吉林、黑龙江、湖南、海南 |
| 2005 | 北京、上海、广东、海南、福建、江西、湖南 | 2013 | 北京、上海、广东、天津、吉林、黑龙江、湖南 |
| 2006 | 北京、上海、广东、海南、福建、江西 | 2014 | 北京、上海、广东、天津、吉林、黑龙江、湖南 |
| 2007 | 北京、上海、广东、海南、福建、江西 | 2015 | 北京、上海、广东、天津、吉林、黑龙江、湖南 |
| 2008 | 北京、上海、广东、海南、福建、江西、湖南 | 2016 | 北京、天津、上海、广东、新疆、吉林、黑龙江、湖南 |
注:表中斜体字的省份为考虑能源消费的清洁化结构后新增的节能与环保一致的省份。 |
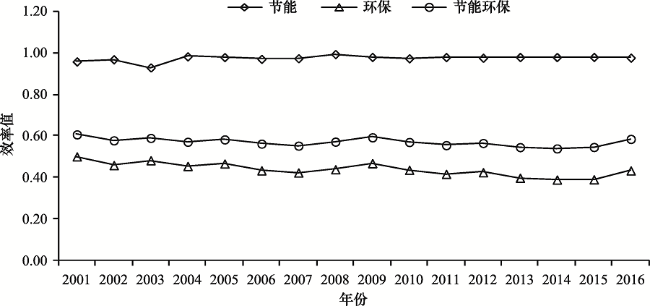
Figure 2 Average values of total factor efficiency of energy saving, environmental protection, and energy saving and environmental protection in China from 2001 to 2016图2 2001—2016年中国全要素的节能效率、环保效率、节能环保效率均值 |
Table 5 Probit model estimation results (1)表5 Probit模型估计结果(1) |
| 变量 | Z1 | Z12 | Z2 | Z3 | C(常数项) |
|---|---|---|---|---|---|
| 系数 | -2.173 6* | 0.374 2* | -8.457 6* | -2.145 8* | 5.398 5* |
| McFadden R2 | 0.385 5 | LR statistic | 114.900 6 | AIC | 0.715 3 |
| 期望—预测表检验 | 82.96% | Prob(LR statistic) | 0.000 0 | SC | 0.782 0 |
注:*,**,***分别表示在1%,5%,10%水平上显著。 |
Table 6 Probit model estimation results (2)表6 Probit模型估计结果(2) |
| 变量 | 估计系数 | 偏效应 | 变量 | 估计系数 | 偏效应 |
|---|---|---|---|---|---|
| Z1 | -13.817 4* | -0.012 7 | X4 | -0.056 4*** | -0.003 3 |
| Z12 | 0.370 2** | — | X5 | 0.375 9* | 0.022 2 |
| Z2 | -14.979 3* | -0.885 9 | X6 | -0.152 0* | -0.009 0 |
| Z3 | -3.395 7** | -0.200 8 | X7 | — | — |
| X1 | -57.927 1* | -0.005 9 | X8 | — | — |
| X12 | 2.379 9* | — | X9 | -1.322 7* | -0.034 1 |
| Z1×X1 | 1.130 8** | — | X92 | 0.067 5 | — |
| X2 | 0.091 8** | 0.005 4 | X10 | -0.087 9* | -0.005 2 |
| X3 | -0.100 2** | -0.005 9 | X11 | 0.067 1** | 0.004 0 |
| McFadden R2 | 0.645 4 | 常数项 | 339.276 9* | — | |
| 期望预测表检验 | 90.74% | AIC | 0.517 3 | ||
| LR statistic | 192.370 5 | SC | 0.743 9 | ||
| Prob(LR) | 0.000 0 |
注:*,**,***分别表示在1%,5%,10%水平显著。 |
The authors have declared that no competing interests exist.
| [1] |
|
| [2] |
[
|
| [3] |
[
|
| [4] |
[
|
| [5] |
|
| [6] |
[
|
| [7] |
[
|
| [8] |
[
|
| [9] |
|
| [10] |
|
| [11] |
|
| [12] |
[
|
| [13] |
[
|
| [14] |
国家发展改革委员会, 国家能源局. 能源发展“十三五”规划[EB/OL]. (2017-01-17)[2018-05-16].
[National Development and Reform Commission, National Energy Administration. The 13th Five-Year Plan for Energy Development[EB/OL]. (2017-01-17)[2018-05-16].
|
| [15] |
国家发展改革委员会, 国家能源局. 能源生产和消费革命战略(2016-2030)[EB/OL]. (2017-04-25)[2018-05-16].
[National Development and Reform Commission, National Energy Administration. Energy Production and Consumption Revolutionary Strategy (2016-2030) [EB/OL]. (2017-04-25)[2018-05-16].
|
| [16] |
发展改革委, 能源局, 财政部, 等. 北方地区冬季清洁取暖规划(2017-2021)[EB/OL]. (2017-12-20)[2018-05-16].
[National Development and Reform Commission, National Energy Administration, Ministry of Finance, et al. Winter Cleaning and Heating Plan in the North(2017-2012) [EB/OL]. (2017-12-20)[2018-05-16].
|
| [17] |
[
|
| [18] |
[
|
| [19] |
[
|
| [20] |
[
|
| [21] |
|
| [22] |
[
|
| [23] |
|
| [24] |
[
|
| [25] |
[
|
| [26] |
[
|
| [27] |
[
|
| [28] |
[
|
| [29] |
[
|
| [30] |
[
|
| [31] |
[
|
| [32] |
[
|
| [33] |
[
|
| [34] |
[
|
| [35] |
[
|
| [36] |
[
|
| [37] |
中华人民共和国国家统计局. 中国统计年鉴[M]. 北京: 中国统计出版社, 2002-2017.
[National Bureau of Statistics of the People's Republic of China. China Statistical Yearbook[M]. Beijing: China Statistics Press, 2002-2017. ]
|
| [38] |
国家统计局工业交通统计司, 国家发展和改革委员会能源局. 中国能源统计年鉴[M]. 北京: 中国统计出版社, 2000-2007.
[Department of Industry and Transport Statistics of the People’s Republic of China, Energy Bureau National Department and Reform Commission. China Energy Statistical Yearbook[M]. Beijing: China Statistics Press, 2000-2007. ]
|
| [39] |
国家统计局能源统计司, 国家能源局综合司. 中国能源统计年鉴[M]. 北京: 中国统计出版社, 2008.
[ Department of Energy Statistics, National Bureau of Statistics of the People’s Republic of China, Department of General Affairs National Energy Administration of the People’s Republic of China. China Energy Statistical Yearbook[M]. Beijing: China Statistics Press, 2008. ]
|
| [40] |
国家统计局能源统计司. 中国能源统计年鉴[M]. 北京: 中国统计出版社, 2009-2017.
[Department of Energy Statistics, National Bureau of Statistics of the People’s Republic of China. China Energy Statistical Yearbook[M]. Beijing: China Statistics Press, 2009-2017. ]
|
| [41] |
国家统计局, 国家环境保护总局. 中国环境统计年鉴[M]. 北京: 中国统计出版社, 2002-2007.
[ National Bureau of Statistics, State Environmental Protection Administration. China Statistical Yearbook on Environment[M]. Beijing: China Statistics Press, 2002-2007. ]
|
| [42] |
国家统计局, 环境保护部. 中国环境统计年鉴[M]. 北京: 中国统计出版社, 2008-2017.
[ National Bureau of Statistics, Ministry of Environmental Protection. China Statistical Yearbook on Environment[M]. Beijing: China Statistics Press, 2008-2017. ]
|
| [43] |
[
|
| [44] |
[
|
| [45] |
[
|
| [46] |
[
|
| [47] |
[
|
| [48] |
|
/
| 〈 |
|
〉 |