
Agricultural development and technological changes in Fujian and Taiwan
Received date: 2017-10-31
Request revised date: 2018-07-25
Online published: 2018-10-20
Copyright
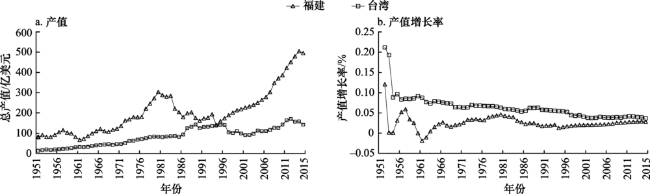
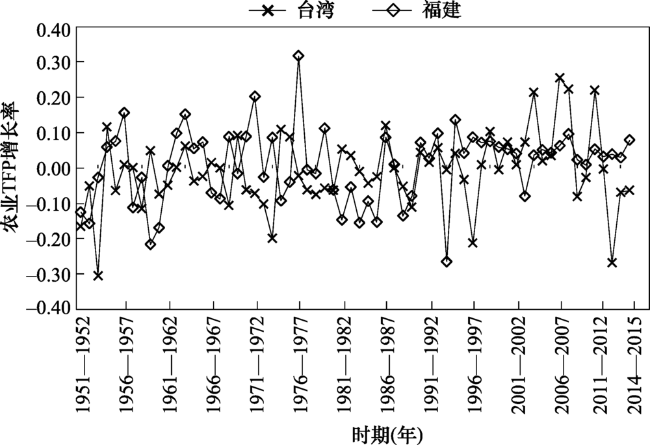
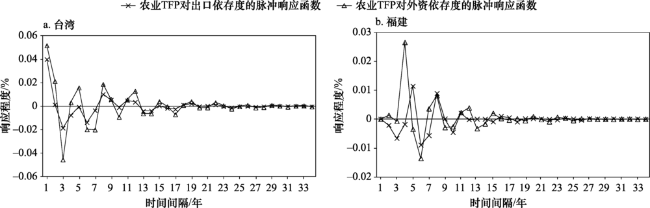
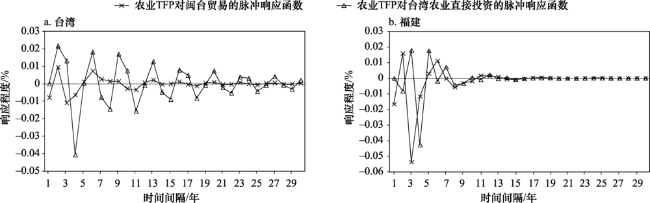
By comparing agricultural development path between Fujian and Taiwan and extracting their characteristics, this study further implemented Malmquist index to estimate Agricultural Total Factor Productivity (TFP) of the two regions. A VAR model was built to analyze the driving factors of TFPs’ growth during 1951-2015 of Fujian and Taiwan. The main results illustrated that agriculture of Fujian and Taiwan was experiencing a rapid growth rate. The total agricultural output value in Fujian was larger than Taiwan, while agriculture of Taiwan did exhibit a higher growth rate than Fujian. However, the development gap between them is narrowing. Crop Farming is the major industry within agriculture in Fujian and Taiwan. The proportions of Animal Husbandry and Fishery in Taiwan and of Fishery in Fujian changed during 65 years. The industrial structure complementarily in agricultures and the competition and cooperation of agricultural TFP of Taiwan and Fujian indicated a cooperative potential in agriculture between the two regions. Agricultural TFP of the two regions increased during 1951-2015. This study identified that the agricultural TFP of Fujian and Taiwan swings back and forth, while the index of Fujian rises, but the index of Taiwan slightly falls. As for the driving factors, gradual opening-up does accelerate the technological changes, which persists and continues to affect the agricultural TFP in Taiwan and Fujian. The effects iterate with time. In other words, gradual opening-up has continuously affected the agricultural development of Fujian and Taiwan. However, the FDI, TDI (Taiwan Direct Investment) and trade have different impact on Taiwan and Fujian in different opening-up stages. Moreover, the influence of agricultural trade between Taiwan and Fujian will be continuously manifesting. The key findings of the paper have an important policy implication.
CHEN Jia , WEI Suqiong , CHEN Songlin . Agricultural development and technological changes in Fujian and Taiwan[J]. Resources Science, 2018 , 40(10) : 1980 -1990 . DOI: 10.18402/resci.2018.10.07
Table 1 The descriptive statistics of variables表1 变量描述性统计 |
| 变量/单位 | 变量代码 | 地区 | 均值 | 标准差 | 样本数 |
|---|---|---|---|---|---|
| 农业产值/亿美元 | NC | 台湾 | 84.780 | 44.961 | 65 |
| 福建 | 204.793 | 108.567 | 65 | ||
| 固投存量/亿美元 | GT | 台湾 | 6.678 | 6.512 | 65 |
| 福建 | 1 292.281 | 2 447.593 | 65 | ||
| 耕地面积/万hm2 | GD | 台湾 | 87.221 | 3.313 | 65 |
| 福建 | 130.987 | 7.608 | 65 | ||
| 劳动力总量/万人 | LA | 台湾 | 123.285 | 45.744 | 65 |
| 福建 | 636.824 | 139.936 | 65 | ||
| 农业出口依存度(EXP) | EXPTW | 台湾 | 57.951 | 8.277 | 38 |
| EXPFJ | 福建 | 0.016 | 0.009 | 38 | |
| 农业外资依存度(FDI) | FDITW | 台湾 | 0.011 | 0.021 | 38 |
| FDIFJ | 福建 | 0.001 | 0.001 | 38 | |
| 闽台贸易总额/亿美元 | MTT | 51.882 | 42.193 | 28 | |
| 台商对福建农业直接投资总额/亿美元 | TDI | 0.644 | 0.343 | 28 | |
| 闽台农业贸易总额/亿美元 | MTN | 5.141 | 5.777 | 16 |
Figure 1 Total output value and growth rate of agriculture in Fujian and Taiwan from1951 to 2015图1 1951—2015年闽台农业总产值和增长率对比 |
Table 2 Gross output value of agriculture, forest, animal and fishery in Fujian and Taiwan from 1951 to 2015 (%)表2 1951—2015年闽台农林牧渔业产值结构对比 |
| 年份 | 台湾 | 福建 | |||||||
|---|---|---|---|---|---|---|---|---|---|
| 农 | 林 | 牧 | 渔 | 农 | 林 | 牧 | 渔 | ||
| 1951 | 65.25 | 5.66 | 18.5 | 10.59 | 79.65 | 4.91 | 12.17 | 3.27 | |
| 1961 | 64.63 | 5.04 | 21.43 | 8.89 | 77.09 | 5.78 | 6.38 | 10.75 | |
| 1971 | 53.84 | 5.68 | 25.52 | 14.96 | 72.92 | 6.89 | 14.14 | 6.05 | |
| 1981 | 46.23 | 1.95 | 30.71 | 21.11 | 67.60 | 8.23 | 15.59 | 8.57 | |
| 1991 | 45.69 | 0.40 | 28.07 | 25.83 | 52.60 | 10.02 | 21.44 | 15.94 | |
| 2001 | 45.58 | 0.17 | 28.70 | 25.55 | 40.81 | 7.76 | 20.30 | 31.13 | |
| 2011 | 44.17 | 0.08 | 33.48 | 22.27 | 41.60 | 8.70 | 17.55 | 28.66 | |
| 2015 | 48.80 | 0.05 | 32.73 | 18.42 | 43.54 | 8.45 | 15.37 | 29.11 | |
注:限于篇幅,仅列出8个主要年份。 |
Figure 2 The growth rate of agricultural TFP in Fujian and Taiwan from 1951 to 2015图2 1951—2015年闽台农业全要素生产率之增长率 |
Table 3 Unit root, cointegration and hysteresis quality tests results of variable series表3 回归变量序列平稳性、协整及滞后性检验 |
| 开放阶段 | 检验类型 | ADF统计量 | 临界值/% | 滞后性检验 | 协整 检验 | ||||||||||
|---|---|---|---|---|---|---|---|---|---|---|---|---|---|---|---|
| 序列名 | 截距 | 时间趋势 | 平稳性 | t-Statistic | Prob. | 1 | 5 | 10 | 滞后阶数 | AIC值 | |||||
| 对外开放 | LogTFPFJ | 有 | 有 | 一阶 | -5.447 | 0.000 1 | -3.621 | -2.943 | -2.610 | 4 | 0.050 029 | 非协整 | |||
| D(LogGEXPFJ) | 有 | 有 | 二阶差分 | -5.143 | 0.000 2 | -3.632 | -2.948 | -2.613 | |||||||
| D(LogFDIFJ) | 有 | 有 | 二阶差分 | -6.889 | 0.000 0 | -3.632 | -2.948 | -2.613 | |||||||
| LogTFPTW | 无 | 无 | 一阶 | -1.890 | 0.057 0 | -2.632 | -1.951 | -1.611 | 3 | -2.952 239 | 协整 | ||||
| LogEXPTW | 有 | 有 | 一阶 | -3.593 | 0.010 7 | -3.621 | -2.943 | -2.610 | |||||||
| LogFDITW | 有 | 有 | 一阶 | -5.970 | 0.000 0 | -3.621 | -2.943 | -2.610 | |||||||
| 闽台开放 | D(LogMTT) | 有 | 有 | 二阶差分 | -3.236 | 0.029 1 | -3.711 | -2.981 | -2.630 | 非协整 | |||||
| LogTDI | 有 | 有 | 一阶 | -6.372 | 0.000 1 | -4.374 | -3.603 | -3.238 | |||||||
| LogTFPFJ | 有 | 有 | 一阶 | -5.780 | 0.000 1 | -3.699 | -2.976 | -2.627 | 3 | -1.900 018 | |||||
| D(LogTFPTW) | 有 | 有 | 二阶差分 | -8.932 | 0.000 0 | -3.724 | -2.986 | -2.633 | 3 | 0.313 575 | |||||
| 全面开放 | D(LogMTN) | 有 | 有 | 二阶差分 | -6.856 | 0.000 1 | -4.004 | -3.099 | -2.690 | ||||||
| LogTFPFJ | 有 | 有 | 一阶 | -3.436 | 0.026 3 | -3.959 | -3.081 | -2.681 | 3 | -1.900 018 | 非协整 | ||||
| D(LogTFPTW) | 有 | 有 | 二阶差分 | -8.304 | 0.000 0 | -4.057 | -3.120 | -2.701 | 2 | 0.313 575 | 协整 | ||||
注:1)根据平稳性检验结果,若取对数后变量平稳,则其平稳性记为一阶,若序列不平稳,则差分序列再次检验,平稳则记为二阶差分(序列名首字母为D);2)滞后阶数为各变量组之最优滞后阶数,由于各阶段变量组不同,因而后期仅标注于各阶段福建与台湾全要素生产率序列后;3)协整检验仅针对原序列非平稳之变量,决定其构建VAR模型的方式。 |
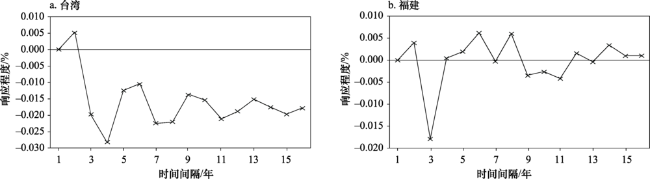
Figure 3 Response of agricultural TFP to export and FDI图3 闽台TFP对出口及外资因子的脉冲响应 |
Figure 4 Response of agricultural TFP to trade between Fujian and Taiwan and TDI图4 闽台TFP对闽台贸易及台湾农业直接投资因子的脉冲响应 |
Figure 5 Response of agricultural TFP to agricultural trade between Fujian and Taiwan图5 闽台农业TFP对闽台农业贸易因子的脉冲响应 |
The authors have declared that no competing interests exist.
| [1] |
|
| [2] |
[
|
| [3] |
|
| [4] |
|
| [5] |
|
| [6] |
|
| [7] |
|
| [8] |
|
| [9] |
[
|
| [10] |
[
|
| [11] |
|
| [12] |
|
| [13] |
|
| [14] |
|
| [15] |
[
|
| [16] |
|
| [17] |
|
| [18] |
[
|
| [19] |
[
|
| [20] |
|
| [21] |
[
|
| [22] |
[
|
| [23] |
|
| [24] |
[
|
| [25] |
|
| [26] |
|
| [27] |
[
|
| [28] |
[
|
| [29] |
[
|
| [30] |
[
|
| [31] |
[
|
| [32] |
[
|
| [33] |
[
|
| [34] |
|
| [35] |
台湾地区行政管理机构农业委员会. 农业统计年报[M]. 台北: 台湾统计学社, 2012-2015.
[ Council of Agriculture of the Taiwan Regional Administrative Authority. Annual Report on Agricultural Statistics[M]. Taipei: Chief executive of the Executive Academy, 2012-2015. ]
|
| [36] |
福建省统计局. 福建统计年鉴[M]. 北京: 中国统计出版社, 1984-2015.
[ Bureau of Statistics of Fujian Province. Fujian Statistical Yearbook [M]. Beijing: China Statistics Press, 1984-2015. ]
|
| [37] |
福建省统计局. 福建奋进的四十年(1949-1989)[M]. 北京: 中国统计出版社, 1989.
[ Bureau of statistics of Fujian Province. The Forty Years of Fujian's Endeavour (1949-1989)[M]. Beijing: China Statistics Press, 1989. ]
|
| [38] |
《光辉的历程-福建五十年》编委会. 光辉的历程-福建五十年[M]. 北京: 中国统计出版社, 1999.
[
|
| [39] |
福建省环境保护厅. 环境状况公报[EB/OL]. (2018-05-30)[2018-07-25].
[ Fujian Environmental Protection Department. Environmental Bulletin [EB/OL]. (2018-05-30)[2018-07-25].
|
| [40] |
|
| [41] |
世界银行. WDI数据库[EB/OL]. (2016-01-01)[2015-12-30].
[World bank. WDI Database[EB/OL]. (2016-01-01)[2015-12-30].
|
| [42] |
中国国家统计局. 中国统计年鉴[M]. 北京: 中国统计出版社, 1984-2015.
[ Bureau of statistics of China. China Statistical Yearbook[M]. Beijing: China Statistics Press, 1984-2015. ]
|
| [43] |
中华人民共和国商务部. 国务院关于鼓励台湾同胞投资的规定[EB/OL]. (1988-07-03)[ 2018-07-25].
[Ministry of Commerce of the People’s Republic of China. Rules of the State Council on Encouraging Investment by Taiwan Compatriots[EB/OL]. (1988-07-03)[ 2018-07-25].
|
| [44] |
[
|
| [45] |
[
|
| [46] |
|
| [47] |
[
|
| [48] |
[
|
| [49] |
[
|
/
| 〈 |
|
〉 |