
Relocation, farmland transfer and livelihood transformation of reservoir resettlement
Received date: 2018-03-21
Request revised date: 2018-06-11
Online published: 2018-10-20
Copyright
To solve the problem of expanding the environmental capacity of resettlement and to continue the original livelihood mode of migrants, the resettlement mode of immigrants changed from the latter-migratory to the out-migratory. It is a major adjustment of the development relocation policy of large and medium-sized water conservancy and hydropower projects. With the rising cost of immigration and the changing economic society, it is increasingly doubtful whether this policy can achieve the prospective. In order to objectively evaluate its impacts, the mechanism of the possible alienation effect of agricultural resettlement was identified in this study. The survey data of emigration in the middle route project of South-to-North Water Diversion Project from 2008 to 2014 were adopted. This study characterized the impact of emigration policy on land disposal behavior and livelihood transformation of migrants by PSM-DID. The result showed that under the coupling of the pressure of adaptation and the institutional changes in social development, migrants waived agricultural production and transferred the land. Non-agricultural transformation promoted land transfer in the relocation area. However, only relying on land policy cannot effectively enhance the landlord income from these lands. The emigration leads to the delayed recovery of the human capital of migrants, which seriously limits the employment rate and income affects the sustainability of the transformation of non-agricultural livelihood of migrants. Therefore, in the early stage of resettlement, more attention should be paid to the quality of compensation land and the location of resettlement area. Meanwhile, the resettlement mode of landlessness should be strengthened. To prevent the risks from non-effective resettlement policy, the land market should be activated, skill training should be carried out, employment channels should be expanded, and the lowest guarantee should be implemented in the latter support period.
ZHAO Xu , XIAO Jiaqi , DUAN Yuefang . Relocation, farmland transfer and livelihood transformation of reservoir resettlement[J]. Resources Science, 2018 , 40(10) : 1954 -1965 . DOI: 10.18402/resci.2018.10.05
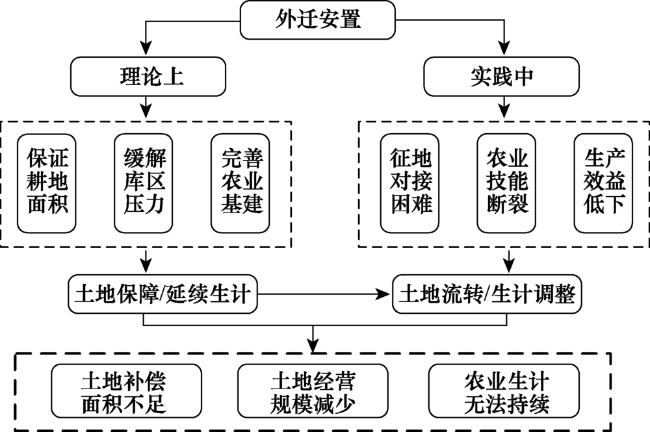
Figure 1 The alienation effect of out-migratory mode图1 外迁安置模式的异化效应 |
Table 1 Definition and description of DID model表1 DID模型各参数说明 |
| 子样本 | 搬迁前(dt = 0) | 搬迁前(dt = 1) | Difference |
|---|---|---|---|
| 外迁户(控制组,du = 0) | β0 | β0+β2 | ΔY0+β2 |
| 后靠户(处理组,du = 1) | β0+β1 | β0+β1+β2+β3 | ΔY1=β2+β3 |
| DID | ΔΔY=β3 |
Table 2 Land disposal and livelihood of migrant sample households表 2 移民样本户的土地处置及生计情况 |
| 安置方式 | 外迁安置 | 后靠安置 | 总体 | |||||
|---|---|---|---|---|---|---|---|---|
| 搬迁前 | 搬迁后 | 搬迁前 | 搬迁后 | 搬迁前 | 搬迁后 | |||
| 样本数/户 | 403 | 403 | 114 | 114 | 517 | 517 | ||
| 自种户占比/% | 92.31 | 29.78 | 96.49 | 78.05 | 94.40 | 40.50 | ||
| 土地转出户占比/% | 3.97 | 64.02 | 2.63 | 21.05 | 3.68 | 54.55 | ||
| 土地转入户占比/% | 3.72 | 6.20 | 0.88 | 0.90 | 3.09 | 5.03 | ||
| 户均土地承包面积/亩 | 7.91 | 6.36 | 4.34 | 2.18 | 7.13 | 5.44 | ||
| 户均转出土地面积/亩 | 0.30 | 3.72 | 0.08 | 0.43 | 0.25 | 2.99 | ||
| 户均转入土地面积/亩 | 3.18 | 2.53 | 0.88 | 2.19 | 2.68 | 2.46 | ||
| 户均本地非农劳动时间/天 | 58.90 | 81.53 | 74.09 | 103.23 | 62.00 | 86.18 | ||
| 户均外出务工劳动时间/天 | 56.73 | 79.05 | 61.38 | 74.71 | 57.66 | 78.12 | ||
注:1亩=0.066 7hm2 |
Table 3 Definition and description of variables in the DID model表3 DID模型中的变量说明及描述性统计 |
| 变量分类 | 变量名 | 定义 | 均值 | 标准差 |
|---|---|---|---|---|
| 因变量 | 土地流转的比例 | 参与土地流转的面积占比 | 0.870 | 0.970 |
| 自变量 | 安置模式 | 外迁=0;后靠=1 | 0.221 | 0.172 |
| 控制变量 | ||||
| 家庭禀赋 | 劳动力数量/人 | 移民户中18~60岁人口数量 | 3.180 | 1.390 |
| 人均受教育年限/年 | 家庭成员平均受教育的年限 | 7.737 | 2.332 | |
| 生计情况 | 人均年收入 | 家庭人均纯收入取自然对数 | 9.469 | 0.479 |
| 家庭现金支出 | 家庭现金支出取自然对数 | 9.296 | 1.221 | |
| 非农收入占比 | 非农收入占总收入的比重 | 0.718 | 0.158 | |
| 外出务工时间/月 | — | 2.190 | 3.470 | |
| 本地非农劳动时间/月 | — | 2.390 | 3.780 | |
| 土地特征 | 土地补偿面积/亩 | 安置中获得的土地补偿面积 | 5.442 | 2.809 |
| 土地年租金 | 流转土地的租金取自然对数 | 6.505 | 0.522 | |
| 土地流转政策认知 | 见注释 | 2.647 | 0.664 | |
注:由“是否自愿流转土地”,“土地流转是否促成双赢”,“是否更愿意将土地流转给企业(相较熟人)”,“是否以土地租金为首要标准”四个指标极差标准化[23];1亩=0.066 7hm2。 |
Table 4 The influence of resettlement on the land transfer of migrants表4 外迁安置对移民土地流转的影响 |
| 解释变量 | 土地流转的比例(model 1) | 土地流转的比例(model 2) | |||||
|---|---|---|---|---|---|---|---|
| 系数 | 标准差 | t值 | 系数 | 标准差 | t值 | ||
| dt | -0.013 | 0.018 | -0.680 | -0.125*** | 0.030 | -4.170 | |
| du | 0.493*** | 0.025 | 19.550 | 0.343*** | 0.035 | 9.760 | |
| du×dt | 0.387*** | 0.042 | -9.150 | -0.275*** | 0.052 | -5.320 | |
| 劳动力数量 | -0.005 | 0.007 | -0.630 | ||||
| 人均受教育年限 | -0.006 | 0.008 | -0.560 | ||||
| 人均年收入 | 0.018 | 0.051 | 0.360 | ||||
| 家庭现金支出 | -0.100*** | 0.037 | -0.270 | ||||
| 非农收入占比 | 0.046 | 0.041 | 1.110 | ||||
| 外出务工时间 | 0.008** | 0.003 | 2.450 | ||||
| 本地非农劳动时间 | 0.020*** | 0.003 | 5.690 | ||||
| 土地补偿面积 | 0.076*** | 0.080 | -8.940 | ||||
| 土地年租金 | -0.012** | 0.032 | -3.750 | ||||
| 土地流转政策认知 | 0.094*** | 0.016 | -5.730 | ||||
| 常数项 | 0.043*** | 0.010 | 4.370 | 0.608** | 0.248 | 2.450 | |
| R2=0.29,F-test=191.60 | R2=0.38,F-test=51.96 | ||||||
注: *、**和***分别表示在10%、5%和1%的水平上显著。 |
Table 5 The differences of covariates of different resettlement modes in Logistic model表5 Logistic模型中不同安置模式下各协变量的差异 |
| 控制变量 | 系数 | 标准差 | z值 | P>|z| |
|---|---|---|---|---|
| 劳动力数量 | -0.153** | 0.069 | -2.220 | 0.026 |
| 家庭现金支出 | -3.990*** | 0.324 | -12.350 | 0.000 |
| 外出务工时间 | 0.046* | 0.026 | 1.740 | 0.083 |
| 本地非农劳动时间 | 0.079*** | 0.025 | 3.170 | 0.002 |
| 土地补偿面积 | -13.725*** | 2.200 | -6.240 | 0.000 |
注:*、**和***分别表示在 10%、5%和1%的水平上显著。 |
Table 6 The matching and balance test of samples about emigration-backward migration表6 外迁-后靠移民样本匹配及平衡性检验 |
| 变量 | 样本 | 均值 | 标准偏误/10% | 标准误绝对值减少/10% | t | p>|t| | |
|---|---|---|---|---|---|---|---|
| 处理组 | 控制组 | ||||||
| 劳动力数量 | 匹配前 | 2.754 | 3.305 | -42.7 | 94.5 | -5.53 | 0.000 |
| 匹配后 | 2.867 | 2.836 | 2.3 | 0.25 | 0.806 | ||
| 家庭现金支出 | 匹配前 | 3.950 | 4.356 | -114.1 | 99.3 | -17.25 | 0.000 |
| 匹配后 | 4.016 | 4.019 | -0.8 | -0.08 | 0.933 | ||
| 本地非农劳动时间 | 匹配前 | 2.861 | 2.261 | 15.2 | -17.7 | 2.12 | 0.034 |
| 匹配后 | 2.828 | 2.718 | 1.2 | -0.73 | 0.909 | ||
| 外出务工时间 | 匹配前 | 2.196 | 2.186 | 0.3 | -751.1 | 0.04 | 0.970 |
| 匹配后 | 2.261 | 2.178 | 2.3 | -0.23 | 0.819 | ||
| 土地补偿面积 | 匹配前 | 4.340 | 7.910 | -34.8 | 65.7 | -15.48 | 0.000 |
| 匹配后 | 5.051 | 6.158 | 0.6 | 0.19 | 0.715 | ||
注:参与匹配的样本数为517个,其中处理组的样本数114个,参照样本数403个,R2= 0.38。 |
Table 7 The PSM-DID robustness test of the land transfer of migrants promoted by the resettlement表7 外迁安置推动移民土地流转的PSM-DID稳健性检验 |
| 土地流转的比例(model 2)(匹配前) | 土地流转的比例(model 3)(匹配后) | ||||||||
|---|---|---|---|---|---|---|---|---|---|
| 结果变量 | 系数 | 标准差 | t值 | P>|t| | 系数 | 标准差 | t值 | P>|t| | |
| 搬迁前 | |||||||||
| 外迁户 | 0.608 | 0.056 | |||||||
| 后靠户 | 0.483 | 0.032 | |||||||
| Diff (T-C) | -0.125*** | 0.030 | -4.19 | 0.000 | -0.024 | 0.023 | -1.07 | 0.284 | |
| 搬迁后 | |||||||||
| 外迁户 | 0.951 | 0.535 | |||||||
| 后靠户 | 0.551 | 0.095 | |||||||
| Diff (T-C) | -0.400*** | 0.045 | 8.92 | 0.000 | -0.441*** | 0.035 | 12.73 | 0.000 | |
| DID | -0.275*** | 0.052 | 5.32 | 0.000 | -0.416*** | 0.041 | 10.04 | 0.000 | |
注:*、 **和***分别表示在10%、5%和1%的水平上显著。 |
Table 8 The influence of double transition process(du×dt)on each control variable: Logistic model表8 二重变迁过程(du×dt)对各控制变量的影响:Logistic模型 |
| 控制变量 | 受教育年限 | 人均年收入 | 家庭现金支出 | 外出务工时间 | 本地非农劳动时间 | 土地流转政策认知 |
|---|---|---|---|---|---|---|
| 安置模式(du) | -0.128 | -0.011 | -0.277*** | 0.157 | 0.492 | -0.737*** |
| (0.135) | (0.024) | (-8.470) | (0.430) | (1.230) | (-12.160) | |
| 搬迁前后(dt) | -0.219E-16 | 0.041 | 0.108*** | 0.722*** | 0.730*** | -1.404*** |
| (-0.064) | (0.016) | (4.950) | (2.960) | (2.760) | (-34.890) | |
| 二重变迁 (du×dt) | 1.000E-16 | 0.012 | -0.258*** | -0.294 | 0.216 | 1.457*** |
| (0.191) | (0.035) | (-5.570) | (-0.570) | (0.380) | (17.200) | |
| 常数项 | 3.052 | 4.007 | 4.303*** | 1.825*** | 1.896*** | 2.702*** |
| (0.045) | (0.011) | (280.050) | (10.600) | (10.120) | (94.940) | |
| R2 | 0.003 | 0.012 | 0.251 | 0.009 | 0.015 | 0.542 |
| N | 1 034 | 1 034 | 1 034 | 1 034 | 1 034 | 1 034 |
注:*、 **和***分别表示在10%、5%和1%的水平上显著;此处主要报告教育、收入及表4中对移民土地流转有显著影响的协变量;括号内为稳健标准误。 |
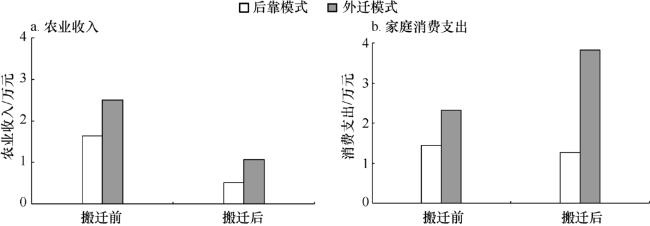
Figure 2 Trends of agricultural income and total household consumption under different resettlement modes图2 不同安置模式下农业收入及家庭总消费的变化趋势 |
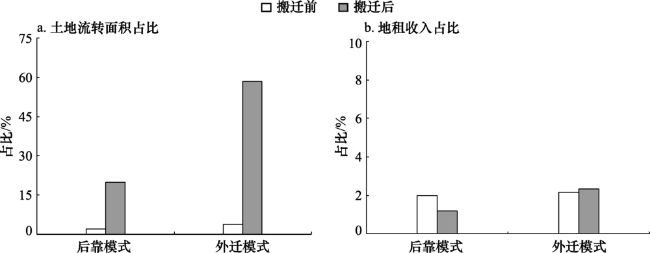
Figure 3 Trends in proportion of Land circulation area and land rent income before and after relocation图3 搬迁前后土地流转面积及地租收入占比的变化趋势 |
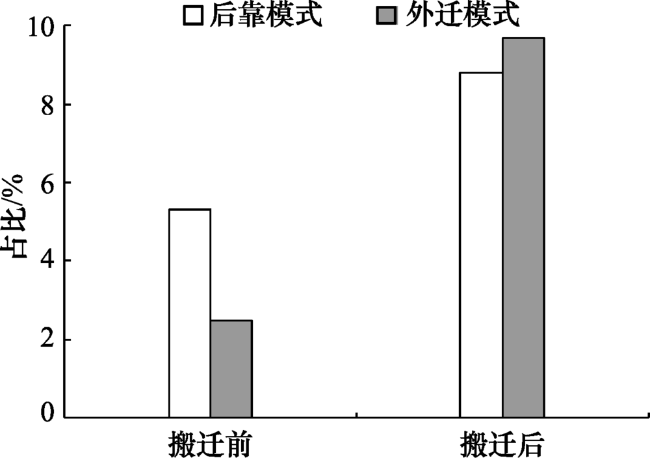
Figure 4 Trends in proportion of unemployed migrants under different resettlement modes图4 不同安置模式下搬迁前后失业移民占比变化趋势 |
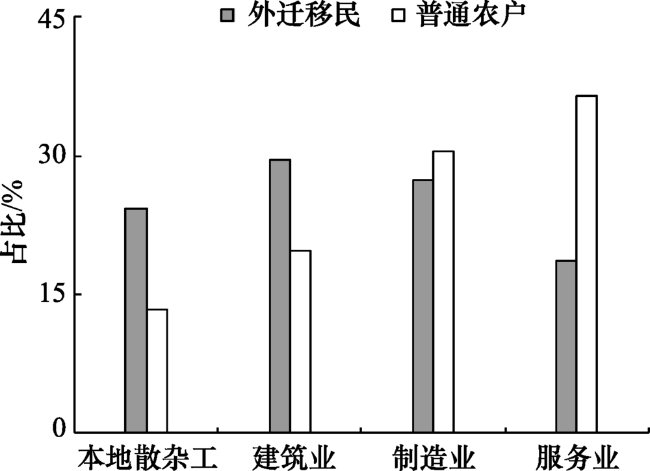
Figure 5 The proportion of employment structures about migrants and natives图5 移民与原住民务工所在行业占比 |
Table 9 Marginal effect of non-farm labor time in different educational background表9 不同教育程度下非农劳动时间的边际影响 |
| 土地流转的比例 | 系数 | 标准误 | t值 | p>|t| |
|---|---|---|---|---|
| 外出务工时间的偏效应 | ||||
| 受教育程度高 | 0.019 | 0.010 | 1.970 | 0.050 |
| 受教育程度低 | 0.004 | 0.006 | 0.660 | 0.510 |
| 本地非农劳动时间的偏效应 | ||||
| 受教育程度高 | 0.034 | 0.008 | 4.190 | 0.000 |
| 受教育程度低 | 0.015 | 0.006 | 2.360 | 0.019 |
The authors have declared that no competing interests exist.
| [1] |
|
| [2] |
[
|
| [3] |
中华人民共和国国务院. 大中型水利水电工程建设征地补偿和移民安置条例 [Z].2006-09-01.
[ State Council of the People's Republic of China. Land requisition compensation and resettlement regulations of large and medium-sized water conservancy and hydropower projects[Z].2006-09-01. ]
|
| [4] |
|
| [5] |
[
|
| [6] |
|
| [7] |
|
| [8] |
[
|
| [9] |
[
|
| [10] |
[
|
| [11] |
[
|
| [12] |
[
|
| [13] |
|
| [14] |
|
| [15] |
[
|
| [16] |
[
|
| [17] |
[
|
| [18] |
|
| [19] |
[
|
| [20] |
[
|
| [21] |
|
| [22] |
[
|
| [23] |
[
|
| [24] |
|
| [25] |
[
|
| [26] |
国家统计局农村社会经济调查司. 2015年农民工监测调查报告[R]. 北京: 国家统计局, 2016.
[Department of rural social and economic investigation of the National Bureau of Statistics. report on the monitoring and investigation of migrant workers in 2015 [R]. Beijing: National Bureau of Statistics of China, 2016. ]
|
/
| 〈 |
|
〉 |