
A study on liabilities accounting methods for excessive consumption of land resources when compiling natural resource asset balance sheets
Received date: 2018-01-24
Request revised date: 2018-04-23
Online published: 2018-05-10
Copyright
The definition and accounting of resource excessive consumption in the process of accounting natural resource liabilities is one of the key issues in exploring and compiling natural resource asset balance sheets (NRABs). Confirming the standard of resource rational utilization is the premise of accurately measuring resource excessive consumption. The objective of this study is to provide an alternative accounting method for land liabilities caused by land resource excessive consumption, specifically caused by unnecessary construction land expansion. The basic issue is demarcating indicators and thresholds of land resource excessive consumption measured by indirect judgment of the rationality for natural land use (including farmland, forest, grassland) through assessing the necessity of construction land expansion. Because of urban areas at different development stages have diverse resource utilization efficiency, we took the typical central cities on major function-oriented zones as samples to analyze development stages and resource utilization efficiencies. This method takes the GDP carrying efficiency and population carrying efficiency of new construction land as indictors and consists of three procedures: judging urban development stages, confirming the threshold of construction land rational expansion and accounting liabilities of land resources. This study is expected to establish a regional targeted and development stage targeted land resource liabilities accounting technology. It takes land resource carrying capacity as a ruler and promotes the formation of a sustainable land use model that guarantees the development of urban and conservation.
XUE Zhichao , YAN Huimin , DU Wenpeng , YANG Yanzhao . A study on liabilities accounting methods for excessive consumption of land resources when compiling natural resource asset balance sheets[J]. Resources Science, 2018 , 40(5) : 919 -928 . DOI: 10.18402/resci.2018.05.05
Table 1 The relational deduction of Chenery’s economic stage表1 钱纳里经济阶段划分关系推演 |
| 阶段 | 阶段名称 | 钱纳里标准/美元 | 推演标准人均GDP/元人民币 | ||||
|---|---|---|---|---|---|---|---|
| 1970年 | 2000年 | 2005年 | 2010年 | 2014年 | |||
| 第一阶段 | 初级产品生产阶段I | 100~140 | 3 675.13~5 145.18 | 4 115.40~5 761.56 | 3 710.97~5 195.36 | 3 795.98~5 314.38 | |
| 初级产品生产阶段II | 140~280 | 5 145.18~10 290.37 | 5 761.56~11 523.13 | 5 195.36~10 390.72 | 5 314.38~10 628.76 | ||
| 第二阶段 | 工业化初期 | 280~560 | 10 290.37~20 580.74 | 11 523.13~23 046.26 | 10 390.72~20 781.44 | 10 628.76~21 257.51 | |
| 工业化中期 | 560~1 120 | 20 580.74~41 161.47 | 23 046.26~46 092.52 | 20 781.44~41 562.88 | 21 257.51~42 515.03 | ||
| 工业化后期 | 1 120~2 100 | 41 161.47~77 177.76 | 46 092.52~86 423.47 | 41 562.88~77 930.39 | 42 515.03~79 715.68 | ||
| 第三阶段 | 发达经济初期 | 2 100~3 360 | 77 177.76~123 484.42 | 86 423.47~138 277.56 | 77 930.39~124 688.63 | 79 715.68~127 545.08 | |
| 发达经济时代 | 3 360~5 040 | 123 484.42~185 226.63 | 138 277.56~207 416.34 | 124 688.63~187 032.94 | 127 545.08~191 317.63 | ||
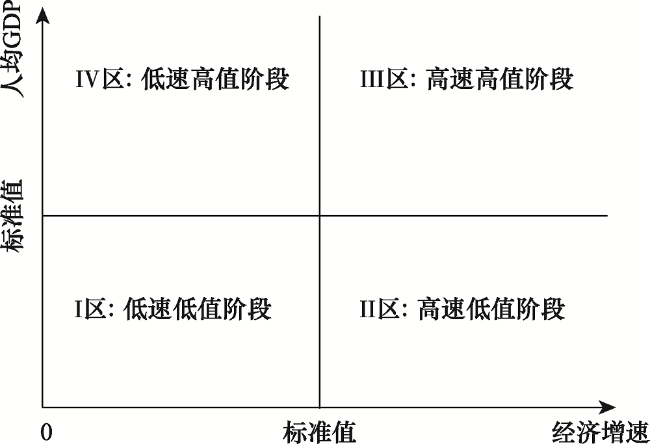
Figure 1 The quadrant division of city’s development stage in China图1 中国城市发展阶段划分标准 |
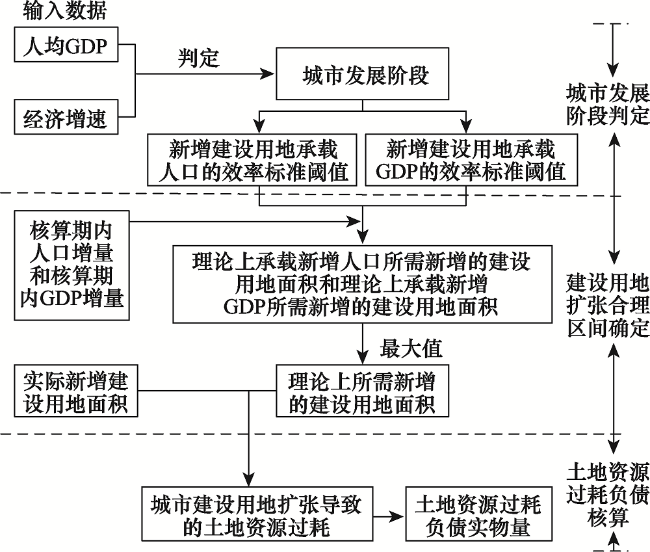
Figure 2 The accounting flow diagram for cities’ land resources liabilities caused by construction land expansion图2 城市建设用地扩张导致的土地资源过耗负债核算流程 |
Table 2 The cities development stage in different years表2 不同年份城市所处阶段 |
| 经济发展阶段 | 2000年 | 2005年 | 2010年 | 2014年 |
|---|---|---|---|---|
| I 区 | 广州,北京,南京,呼和浩特,哈尔滨,兰州,银川,乌鲁木齐,昆明,西安,重庆,武汉,太原,厦门,连云港,合肥,郑州,南宁,贵阳,上海,石家庄 | 哈尔滨,兰州,昆明,武汉,厦门,连云港,石家庄 | 哈尔滨 | 连云港,南宁 |
| II区 | 拉萨,深圳 | 北京,南京,呼和浩特,银川,乌鲁木齐,西安,重庆,太原,合肥,郑州,南宁,贵阳,拉萨 | 兰州,昆明,西安,重庆,连云港,南宁,贵阳,拉萨 | |
| III区 | 广州,深圳,上海 | 南京,呼和浩特,银川,乌鲁木齐,武汉,厦门,合肥,郑州 | 贵阳 | |
| IV区 | 广州,北京,太原,深圳,上海,石家庄 | 广州,北京,南京,呼和浩特,哈尔滨,兰州,银川,乌鲁木齐,昆明,西安,重庆,武汉,太原,厦门,合肥,郑州,拉萨,深圳,上海,石家庄 |
Table 3 The statistical table of sample types by cluster analysis表3 样本聚类分析类型统计 |
| 类型 | I区-GDP | II区-GDP | III区-GDP | IV区-GDP | I区-人口 | II区-人口 | III区-人口 | IV区-人口 |
|---|---|---|---|---|---|---|---|---|
| 大类/个 | 26 | 20 | 9 | 23 | 21 | 19 | 10 | 22 |
| 小类/个 | 4 | 2 | 2 | 2 | 4 | 3 | 1 | 1 |
| 总量/个 | 30 | 22 | 11 | 25 | 25 | 22 | 11 | 23 |
| 大类占比/% | 86.67 | 90.91 | 81.82 | 92.00 | 84.00 | 86.36 | 90.91 | 95.65 |
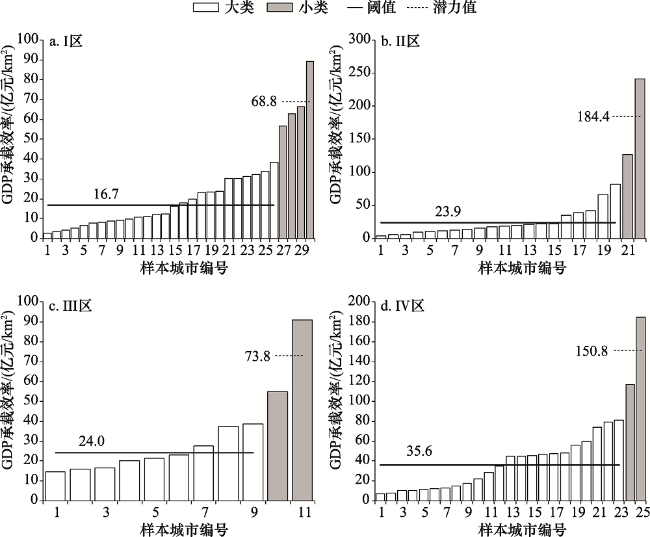
Figure 3 The GDP carrying efficiency of new construction land and the threshold of excessive consumption for land resources in sample cities图3 样本城市新增建设用地GDP承载效率及土地资源过度消耗阈值 |
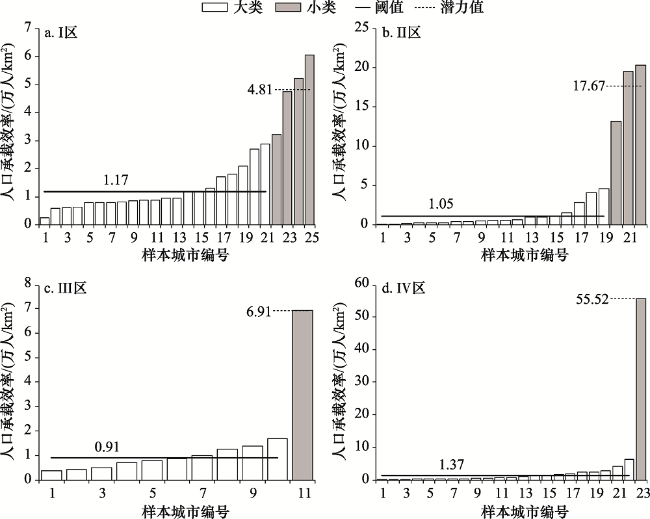
Figure 4 The population carrying efficiency of new construction land and the threshold of excessive consumption of land resources in sample cities图4 样本城市新增建设用地人口承载效率及土地资源过度消耗阈值 |
Table 4 The thresholds of excessive consumption of land resources caused by new construction land for cities in different development stages in China表4 中国不同城市发展阶段的新增城市建设用地导致的土地资源过耗阈值 |
| 阈值指标 | I区:低速低值区 | II区:高速低值区 | III区:高速高值区 | IV区:低速高值区 |
|---|---|---|---|---|
| 新增建设用地承载GDP效率/(亿元/km2) | 16.7 | 23.9 | 24.0 | 35.6 |
| 新增建设用地承载人口效率/(人/km2) | 11 717.4 | 10 510.2 | 9 087.1 | 13 710.9 |
The authors have declared that no competing interests exist.
| [1] |
[
|
| [2] |
[
|
| [3] |
[
|
| [4] |
[
|
| [5] |
[
|
| [6] |
[
|
| [7] |
United Nations, European Commission, Food and Agriculture Organization, ,et al. System of Environmental-Economic Accounting: Central Framework [EB/OL].(2014-10)[2017-09-01].
|
| [8] |
|
| [9] |
[
|
| [10] |
|
| [11] |
[
|
| [12] |
[
|
| [13] |
[
|
| [14] |
[
|
| [15] |
[
|
| [16] |
[
|
| [17] |
[
|
| [18] |
[
|
| [19] |
[
|
| [20] |
[
|
| [21] |
|
| [22] |
[
|
| [23] |
中华人民共和国住房和城乡建设部. 中国城市建设统计年鉴[M]. 北京: 中国建筑工业出版社, 2000—2014.
[Ministry of Housing and Urban-Rural Development of the People's Republic of China. Statistical Yearbook of Urban Construction in China[M]. Beijing: China Architecture & Building Press, 2000-2014. ]
|
| [24] |
|
| [25] |
|
| [26] |
|
| [27] |
|
| [28] |
|
| [29] |
[
|
| [30] |
[
|
| [31] |
[
|
| [32] |
[
|
/
| 〈 |
|
〉 |