
Quantitative measurement and evaluation of geopolitical risks confronting Central Asian major energy exporting countries
Received date: 2017-11-20
Request revised date: 2018-03-13
Online published: 2018-05-02
Copyright
Kazakhstan and Turkmenistan, the two major energy exporting countries in Central Asia, are rich in oil and gas and located in the heartland of the Eurasian Continent. Their geographic location puts their energy exports under tremendous geopolitical pressure from countries along their limited exporting pipelines. In order to safeguard their energy security, they have developed an export diversification strategy to overcome this pressure. Using energy trade data from the United Nations Comtrade Database from 2005 to 2013, we tested the effect of this strategy using three standards: correlation, diversification, and the impact of bilateral relationship. We found that Kazakhstan and Turkmenistan’s oil markets are balanced in terms of correlation and diversification, and thus less subject to geopolitical pressure. Their gas markets, on the other hand, still have tremendous exposure to geopolitical risks for high correlation and lack of diversification. Kazakhstan’s oil and gas markets are more diversified and less correlated than Turkmenistan’s. In terms of overall effect, Kazakhstan usesa typical diversification strategy to reduce geopolitical risks while Turkmenistan adopts a reverse diversification strategy which was more effective during the sample time. In conclusion, the diversification of export routes and markets is essentially a political adjustment to their geopolitical environment made by energy exporting countries in Central Asia instead of economic rationale. Several policy proposals to help these two countries lower their export risk under the framework of the Silk Road Economic Belt are discussed.
CHEN Xiaopeng , CHENG Shengkui , WU Liang . Quantitative measurement and evaluation of geopolitical risks confronting Central Asian major energy exporting countries[J]. Resources Science, 2018 , 40(4) : 773 -783 . DOI: 10.18402/resci.2018.04.11
Table 1 Value assignment chart of the events affecting bilateral relationship表1 影响双边关系事件的赋值表 |
| 分值 | 正面事件 | 分值 | 负面事件 |
|---|---|---|---|
| 6.0 | 允许其他国家在本国领土内建立军事基地 | 6.0 | 破坏能源管道运行; 国内少数族裔分离势力要求独立; 一国武装力量越过边境攻击另一国 |
| 5.0 | 退出特定国家主导的多边经济/军事组织 | ||
| 4.5 | 建立和加入特定国家主导的多边经济/军事组织 | 4.5 | 关闭其他国家在本国领土内建立的军事基地 |
| 4.0 | 允许其他国家的武器装备过境国家领土 | 3.5 | 拒绝其他国家的货物通过本国口岸; 对某一国家实施制裁; 关闭通向其他国家的能源管道; 立法禁止其他国家货运车辆进入本国领土; 一国发生以另一国家主体民族为攻击目标的骚乱,造成重大人员伤亡; 破坏施工中的石油管线 |
| 3.0 | 允许其他国家的非战斗军用物资过境国家领土; 给予其他国家的军用飞机领空通行权; 解除对国家制裁; 免除一个国家债务 | 3.0 | 拒绝承认/还清债务; 撕毁与一国原本的协议 |
| 2.5 | 国家正/副元首或政府首脑进行正式访问; 两国签署能源、划界协定等重大协定 | 2.5 | 提高其他国家能源在本国领土的过境费用; 以某一国家为假想敌进行军事演习; 进行不利于对方的军事部署; 对使用军事基地提出限制; 国家领导人公开场合发生争吵和肢体冲突 |
| 2.0 | 两国同意开放口岸,建立直接经济交流; 一国/国际组织对另一国进行军事和经济援助; 减少其他国家货物/能源在本国领土的过境费用; 取消两国间的签证制度; | 2.0 | 撤出维和/安全部队; 发生边境冲突,造成人员伤亡和财产损失; 拒绝其他国家的特定货物通过本国口岸; 提高其他国家货物在本国领土的过境费用; 取消与其他公司合同; 驱逐在本国就职的其他国家公民; 政府将另一国的企业驱逐本国市场 |
| 1.5 | 国家正/副元首或正政府首脑通电话; 正副外交部长、副政府首脑正式访问、其他部长级官员;访问时获得访问国家元首或政府首脑接见; 两国或多国签署一般条约; 两国和多国(国有)企业签订一般性商业投资合同; 取消贸易保护措施 | 1.5 | 破坏其他国家企业在本国领土的投资工程,造成人身和财产损失; 不参加特定地区组织组织的会议和演习; 对国家元首的家人发起刑事调查; 其他贸易保护措施; 恢复两国间的签证制度; 在公开场合对其他国家进行威胁; 驱逐外交官; 军用飞机侵犯领空; 签署对本国不利的协议 |
| 1.0 | 部长级或副部长级官员进行事务性访问; 国际组织地区事务专员访问; 一国对另一国进行紧急人道主义援助; 两国和多国进行军事演习; 两国之间达成年度协议 | 1.0 | 发表声明,对其他国家提出抗议或反驳其他国家的观点; 紧急约见外交官; 发生以某一特定国家为目标的大规模游行; 外国企业撤资 |
| 0.8 | 国家立法机关首脑或代表团访问; 国有企业或较大国际企业领导访问; 国家元首与国际组织首脑通电话 | 0.5 | 以特定国家为总部的非政府组织作出不利于某个国家的声明或评价; 国际组织或国家质疑一国选举程序和结果 |
Table 2 Correlation coefficients of the import volume of Kazakhstan's top ten crude oil markets from 2005 to 2013表2 2005—2013年哈萨克斯坦前十大原油市场进口量的相关系数 |
| 奥地利 | 加拿大 | 中国 | 法国 | 以色列 | 意大利 | 西班牙 | 荷兰 | 俄罗斯 | 瑞士 | |
|---|---|---|---|---|---|---|---|---|---|---|
| 奥地利 | 0.92 | 0.90 | -0.61 | -0.21 | 0.86 | -0.07 | 0.92 | -0.72 | -0.95 | |
| 加拿大 | 0.73 | -0.29 | -0.06 | 0.72 | -0.03 | 0.78 | -0.65 | -0.95 | ||
| 中国 | -0.66 | -0.19 | 0.94 | 0.04 | 0.98 | -0.55 | -0.86 | |||
| 法国 | 0.58 | -0.63 | -0.03 | -0.69 | 0.41 | 0.40 | ||||
| 以色列 | -0.08 | -0.51 | -0.23 | -0.14 | 0.03 | |||||
| 意大利 | 0.08 | 0.97 | -0.45 | -0.85 | ||||||
| 西班牙 | 0.13 | 0.62 | -0.04 | |||||||
| 荷兰 | -0.50 | -0.89 | ||||||||
| 俄罗斯 | 0.63 |
Table 3 Correlation coefficients of the import volume of Turkmenistan's top ten crude oil markets from 2005 to 2013表3 2005—2013年土库曼斯坦前十大原油市场进口量的相关系数 |
| 奥地利 | 捷克 | 英国 | 法国 | 德国 | 希腊 | 意大利 | 罗马尼亚 | 西班牙 | 瑞士 | |
|---|---|---|---|---|---|---|---|---|---|---|
| 奥地利 | -0.22 | 0.66 | -0.22 | 0.24 | 0.43 | -0.23 | -0.18 | 0.24 | -0.32 | |
| 捷克 | -0.18 | 1.00 | 0.23 | 0.80 | 0.86 | 0.36 | -0.16 | -0.18 | ||
| 英国 | -0.18 | 0.60 | -0.27 | -0.39 | -0.42 | -0.23 | -0.26 | |||
| 法国 | 0.23 | 0.80 | 0.86 | -0.36 | -0.16 | -0.18 | ||||
| 德国 | -0.16 | 0.11 | -0.39 | -0.11 | -0.05 | |||||
| 希腊 | 0.58 | 0.16 | -0.05 | -0.27 | ||||||
| 意大利 | 0.66 | -0.09 | -0.31 | |||||||
| 罗马尼亚 | -0.35 | -0.16 | ||||||||
| 西班牙 | -0.14 |
Table 4 Correlation coefficients of the import volume of Kazakhstan's top ten natural gas markets from 2008 to 2013表4 2008—2013年哈萨克斯坦前十大天然气市场进口量相关系数 |
| 阿富汗 | 中国 | 德国 | 吉尔吉斯坦 | 俄罗斯 | 瑞士 | 乌克兰 | 波兰 | 摩尔多瓦 | 英属维京群岛 | |
|---|---|---|---|---|---|---|---|---|---|---|
| 阿富汗 | 0.43 | 0.68 | -0.71 | -0.74 | -0.93 | 0.00 | -0.83 | 0.43 | 0.84 | |
| 中国 | -0.39 | 0.42 | 0.30 | 0.65 | 0.13 | 0.10 | -0.20 | -0.29 | ||
| 德国 | -0.48 | -0.88 | -0.53 | -0.80 | -0.48 | 0.21 | 0.90 | |||
| 吉尔吉斯坦 | 0.33 | 0.81 | -0.02 | 0.88 | -0.37 | -0.41 | ||||
| 俄罗斯 | 0.55 | 0.91 | 0.46 | 0.06 | -0.93 | |||||
| 瑞士 | 0.28 | 0.79 | -0.43 | -0.64 | ||||||
| 乌克兰 | 0.18 | -0.02 | -0.89 | |||||||
| 波兰 | -0.39 | -0.57 | ||||||||
| 摩尔多瓦 | 0.31 |
Table 5 Correlation coefficients of the import volume of Turkmenistan's natural gas markets from 2008 to 2013表5 2008—2013年土库曼斯坦天然气市场进口量的相关系数 |
| 阿富汗 | 哈萨克斯坦 | 中国 | 匈牙利 | 罗马尼亚 | 乌克兰 | |
|---|---|---|---|---|---|---|
| 阿富汗 | -0.37 | 0.13 | 0.01 | -0.24 | -0.20 | |
| 哈萨克斯坦 | 0.20 | 0.47 | 0.69 | 0.67 | ||
| 中国 | -0.72 | -0.53 | -0.55 | |||
| 匈牙利 | 0.87 | 0.89 | ||||
| 罗马尼亚 | 1.00 |
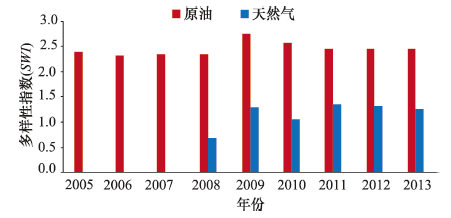
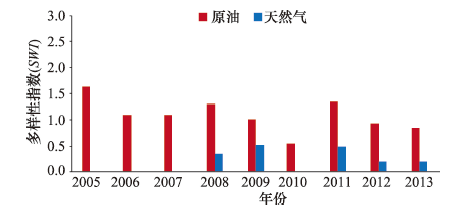
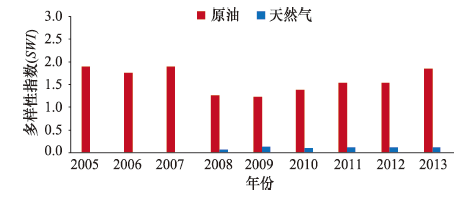
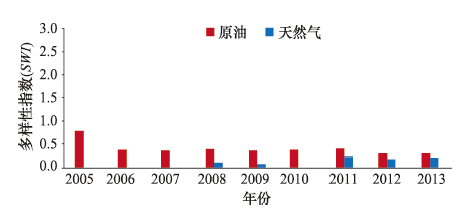
3.2 哈土两国能源市场的多样性评价结果 |
Figure 1 Diversification indicators (SWIs) of Kazakhstan's oil and natural gas markets from 2005 to 2013图1 2005—2013年哈萨克斯坦石油与天然气进口国的多样性指数(SWI) |
Figure 2 Diversification indicators (SWIs)of Turkmenistan's oil and natural gas markets from 2005 to 2013图2 2005—2013年土库曼斯坦石油与天然气进口国的多样性指数 |
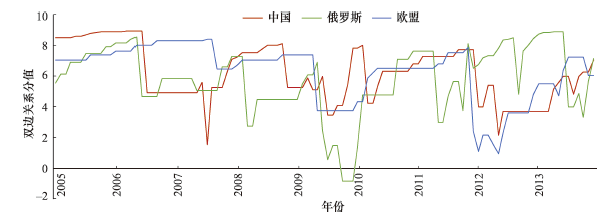
Figure 3 The scores of Kazakhstan's relation between China, Russia and EU from 2005 to 2013图3 2005—2013年哈萨克斯坦与中俄欧三方的双边关系分值 |
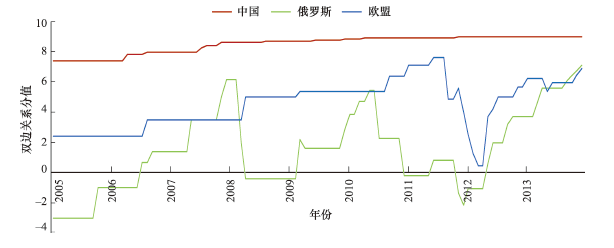
Figure 4 The scores of Turkmenistan's relation between China, Russia and EU from 2005 to 2013图4 2005—2013年土库曼斯坦与中俄欧三方的双边关系分值 |
Figure 5 Adjusted SWIs of Kazakhstan's oil and natural gas markets from 2005 to 2013 by adding the coefficient of international relationship图5 加入国际关系调整后的2005—2013年哈萨克斯坦的石油与天然气市场多样性指数 |
Figure 6 Adjusted SWIs of Turkmenistan's oil and natural gas markets from 2005 to 2013 by adding the coefficient of international relationship图6 加入国际关系调整后的2005—2013年土库曼斯坦石油与天然气市场的多样性指数 |
The authors have declared that no competing interests exist.
| [1] |
|
| [2] |
|
| [3] |
|
| [4] |
|
| [5] |
|
| [6] |
|
| [7] |
|
| [8] |
|
| [9] |
|
| [10] |
|
| [11] |
|
| [12] |
|
| [13] |
|
| [14] |
|
| [15] |
McClelland C. World Event/ Interaction Survey(WEIS) Project, 1966-1978(ICPSR) [EB/OL]. (2006-01-18)[2017-11-11].
|
| [16] |
|
| [17] |
|
| [18] |
Schrodt P A, Gerner D. Analyzing International Event Data: A Handbook of Computer Based Techniques[EB/OL]. (2012-03-22)[2017-11-11].
|
| [19] |
[
|
/
| 〈 |
|
〉 |