
The poverty dynamics in the Agro-Pastoral Transitional Zone in Northern China : a multi-scale perspective based on the poverty gap index
Received date: 2017-03-20
Request revised date: 2017-09-02
Online published: 2018-02-11
Copyright
The Agro-Pastoral Transitional Zone in Northern China (APTZNC) is one of the most impoverished areas in China. Accurately assessing poverty dynamics in the APTZNC is of significance to regional sustainable development. We used the poverty gap index to investigate the dynamics of poverty in the APTZNC from 2000 to 2014 at three scales: regional, sub-regional and county scales. The results showed that all impoverished counties were lifted out of poverty from 2000 to 2014 based on the poverty gap index. At the county scale, the number of impoverished counties decreased by 167 from 2000 to 2014, and the population in impoverished counties decreased by 45.70 million. Specifically, the number of impoverished counties decreased from 167 in 2000 to 10 in 2010, a reduction of 94.01%. The population in impoverished counties decreased from 45.70 million in 2000 to 2.73 million in 2010, a reduction of 94.03%. From 2010 to 2014, the number of impoverished counties decreased by 10 and the population in impoverished counties decreased by 2.73 million. We also found that poverty alleviation from 2000 to 2014 was closely related with economic development. Among all indicators, public fiscal revenue had the highest correlation with poverty alleviation (r = -0.51, P < 0.01). Meanwhile, difference in incomes between urban and rural residents in the out-of-poverty areas increased from 4 455.27 CNY in 2000 to 11 104.71 CNY in 2014, a 2.11-fold increase. The coefficient of variation in per-capita rural income among out-of-poverty counties also increased from 0.24 in 2000 to 0.34 in 2014, an increase of 41.67%. Thus, we suggest that special attention should be paid to reducing income inequity during targeted poverty alleviation to ensure sustainable development of the APTZNC.
REN Qiang , HE Chunyang , HUANG Qingxu , LIU Zhifeng , Li Jingwei . The poverty dynamics in the Agro-Pastoral Transitional Zone in Northern China : a multi-scale perspective based on the poverty gap index[J]. Resources Science, 2018 , 40(2) : 404 -416 . DOI: 10.18402/resci.2018.02.16
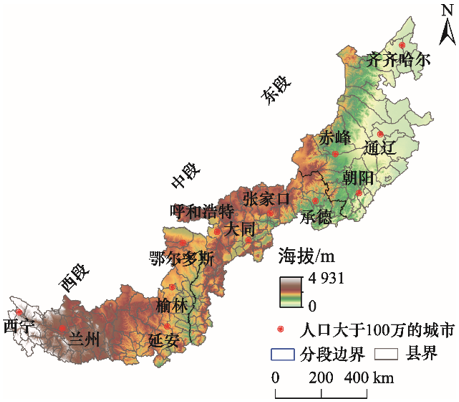
Figure 1 The study area图1 研究区示意 |
Table 1 The status of poverty in the APTZNC in 2000表1 2000年中国北方农牧交错带东中西段居民贫困指标分析 |
| 贫困状态 | 东段 | 中段 | 西段 | 全区 | |
|---|---|---|---|---|---|
| 特别贫困 | 贫困县数量(比例)* | 5(16.67%) | 19(30.16%) | 34(45.94%) | 58(34.73%) |
| 贫困县总人口(比例)** | 248.08(19.55%) | 418.37(30.70%) | 956.26(49.35%) | 1 622.72(35.51%) | |
| 贫困县城镇人口/万人 | 25.94 | 55.35 | 77.04 | 158.33 | |
| 贫困县农村人口/万人 | 222.15 | 363.02 | 879.22 | 1 464.39 | |
| 中等贫困 | 贫困县数量(比例)* | 16(53.33%) | 28(44.44%) | 26(35.14%) | 70(41.92%) |
| 贫困县总人口(比例)** | 679.42(53.54%) | 558.50(40.97%) | 631.11(32.57%) | 1 869.02(40.90%) | |
| 贫困县城镇人口/万人 | 149.08 | 101.35 | 88.49 | 338.93 | |
| 贫困县农村人口/万人 | 530.33 | 457.14 | 542.62 | 1530.09 | |
| 轻微贫困 | 贫困县数量(比例)* | 9(30.00%) | 16(25.40%) | 14(18.92%) | 39(23.35%) |
| 贫困县总人口(比例)** | 341.42(26.91%) | 386.22(28.33%) | 350.38(18.08%) | 1 078.02(23.59%) | |
| 贫困县城镇人口/万人 | 71.67 | 74.35 | 102.45 | 248.47 | |
| 贫困县农村人口/万人 | 269.75 | 311.87 | 247.92 | 829.54 | |
| 合计 | 贫困县数量 | 30 | 63 | 74 | 167 |
| 贫困县总人口/万人 | 1 268.92 | 1 363.09 | 1 937.75 | 4 569.76 | |
| 贫困县城镇人口/万人 | 246.69 | 231.05 | 267.99 | 745.73 | |
| 贫困县农村人口/万人 | 1 022.23 | 1 132.04 | 1 669.76 | 3 824.03 |
注:*括号中的比例表示不同贫困状态下的旗县数量占对应区域旗县总数的比例;**括号中的比例表示不同贫困状态下的旗县人口占对应区域旗县总人口的比例。 |
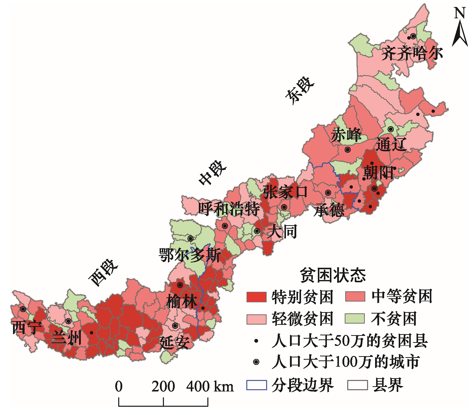
Figure 2 The poverty pattern in the APTZNC in 2000图2 2000年中国北方农牧交错带贫困格局 |
Table 2 Changes of number of poverty counties and population in poverty counties in the APTZNC from 2000 to 2014表2 2000—2014年中国北方农牧交错带贫困县和贫困县人口的变化数量(万人) |
| 时间 | 贫困状态 | 东段 | 中段 | 西段 | 全区 | ||||||
|---|---|---|---|---|---|---|---|---|---|---|---|
| 贫困县数量减少量 | 贫困县人口减少量 | 贫困县数量减少量 | 贫困县人口减少量 | 贫困县数量减少量 | 贫困县人口减少量 | 贫困县数量减少量 | 贫困县人口减少量 | ||||
| 2000—2010年 | 特别贫困 | 5 | 248.08 | 19 | 418.37 | 34 | 956.26 | 58 | 1 622.72 | ||
| 中等贫困 | 16 | 679.42 | 28 | 558.50 | 22 | 523.16 | 66 | 1 761.07 | |||
| 轻微贫困 | 9 | 341.42 | 14 | 317.14 | 10 | 253.70 | 33 | 912.25 | |||
| 合计 | 30 | 1 268.92 | 61 | 1 294.00 | 66 | 1 733.12 | 157 | 4 296.04 | |||
| 2010—2014年 | 特别贫困 | 0 | 0 | 0 | 0 | 0 | 0 | 0 | 0 | ||
| 中等贫困 | 0 | 0 | 0 | 0 | 4 | 107.95 | 4 | 107.95 | |||
| 轻微贫困 | 0 | 0 | 2 | 69.09 | 4 | 96.68 | 6 | 165.76 | |||
| 合计 | 0 | 0 | 2 | 69.09 | 8 | 204.63 | 10 | 273.71 | |||
| 2000—2014年 | 特别贫困 | 5 | 248.08 | 19 | 418.37 | 34 | 956.26 | 58 | 1 622.72 | ||
| 中等贫困 | 16 | 679.42 | 28 | 558.50 | 26 | 631.11 | 70 | 1 869.02 | |||
| 轻微贫困 | 9 | 341.42 | 16 | 386.22 | 14 | 350.38 | 39 | 1 078.02 | |||
| 合计 | 30 | 1 268.92 | 63 | 1 363.09 | 74 | 1 937.75 | 167 | 4 569.76 | |||
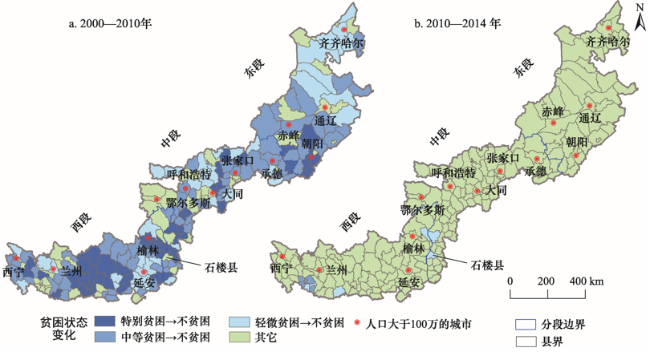
Figure 3 Changes of poverty in the APTZNC from 2000 to 2014图3 2000—2014年中国北方农牧交错带贫困状态变化 |
Table 3 The impacts of different poverty lines on the number of poverty counties and their population (unit: 10 000 persons)表3 不同贫困标准下中国北方农牧交错带的贫困县和贫困县人口数量(万人) |
| 贫困标准 | 贫困线(元/年) | 2000年贫困状态 | 2000—2014年贫困动态 | |||
|---|---|---|---|---|---|---|
| 旗县数量① | 人口① | 旗县数量① | 人口① | |||
| 2000-2007年中国贫困标准② | 668 | -167 | -4 569.76 | -167 | -4 569.76 | |
| 2008-2010年中国贫困标准③ | 1 222 | -166 | -4 514.42 | -166 | -4 514.42 | |
| 2011年中国贫困标准 | 2 300 | -124 | -3 381.20 | -124 | -3 381.20 | |
| 1美元/天的国际贫困标准 | 2 225 | -130 | -3 536.38 | -130 | -3 536.38 | |
| 1.25美元/天的国际贫困标准 | 2 782 | -85 | -2 394.02 | -85 | -2 394.02 | |
注:①本栏使用不同贫困标准评估结果与1.9美元/天贫困标准评估结果的差值来反映不同贫困标准对评估结果的影响;②因2000—2007年中国国家标准变动较小,本文将其视为一个贫困标准,贫困线为该时段份贫困线均值;③因2008—2010年中国国家标准变动较小,本文将其视为一个贫困标准,贫困线为该时段份贫困线均值。 |
Table 4 The validation of the poverty gap index for distinguishing the poverty counties determined by the government表4 贫困距离指数对于识别国家划定的贫困县的有效性 |
| 时间 | 分类 | 贫困距离指数/元 | |||
|---|---|---|---|---|---|
| 国家级贫困县 | 非国家级贫困县 | 集中连片特困区 | 非集中连片特困区 | ||
| 2000年 | 平均值 | 1 438.54 | -117.69 | 1 434.44 | 241.92 |
| 标准差 | 827.82 | 1 863.47 | 977.69 | 1 735.60 | |
| t检验结果 | 存在显著性差异,t =-7.074** | 存在显著性差异,t =-10.688** | |||
| 2010年 | 平均值 | -2 837.99 | -7 133.68 | -2 248.31 | -7 081.60 |
| 标准差 | 2 073.60 | 4 707.92 | 1 858.33 | 4 224.53 | |
| t检验结果 | 存在显著性差异,t =-8.066** | 存在显著性差异,t =-9.816** | |||
| 2014年 | 平均值 | -5 725.48 | -11 043.22 | -5 105.36 | -10 874.14 |
| 标准差 | 2 773.40 | 5 902.57 | 2 633.09 | 5 383.78 | |
| t检验结果 | 存在显著性差异,t =-7.892** | 存在显著性差异,t =-6.098** | |||
注:**P<0.01。 |
Table 5 Major poverty alleviation policies in China and poverty alleviation in APTZNC from 2000 to 2014表5 2000—2014年国家扶贫政策与中国北方农牧交错带脱贫状况 |
| 2000—2010年 | 2010—2014年 | |
|---|---|---|
| 阶段划分 | 大规模扶贫阶段 | 针对性扶贫阶段 |
| 核心文件 | 《中国农村扶贫开发纲要(2001-2010)》 | 《中国农村扶贫开发纲要(2010-2020)》 |
| 扶贫重点 | 中西部少数民族地区、革命老区、边疆地区和特困地区 | 集中连片特困区中的贫困重点县 |
| 奋斗目标 | 1)提高贫困地区经济状况 2)解决贫困人口温饱问题 | 1)推进贫困地区(特别是集中连片特困区)经济发展 2)保障贫困地区人均收入高于区域平均水平 3)缩小贫富差距 |
| 脱贫县数量(脱贫率) | 157个(94.01%) | 10个(100%) |
| 城乡收入差距变化量(变化率) | 5 925元/年(132.99%) | 3 489元/年(33.61%) |
| 贫困县间人均收入的变异系数变化量(变化率) | 0.11(47.17%) | -0.02(-6.02%) |
Table 6 The relationship between the poverty gap index and socioeconomic indices表6 贫困距离指数与社会经济因素的相关性分析 |
| 指标 | 全区 | 东段 | 中段 | 西段 | |
|---|---|---|---|---|---|
| 人口类 | 总人口数量 | -0.157* | -0.383* | -0.086 | -0.147* |
| 城镇人口数量 | -0.495** | -0.446* | -0.496** | -0.505** | |
| 农村人口数量 | 0.247** | 0.247 | 0.266* | 0.241** | |
| 经济类 | 地区生产总值 | -0.463** | -0.464** | -0.438** | -0.485** |
| 第一产业增加值 | -0.058 | -0.447* | -0.164 | -0.067 | |
| 第二产业增加值 | -0.483** | -0.345 | -0.432** | -0.497** | |
| 第三产业增加值 | -0.378** | -0.483** | -0.448** | -0.398** | |
| 规模以上工业总产值 | -0.365** | -0.350 | -0.316* | -0.385** | |
| 规模以上工业企业单位数 | -0.361** | -0.447* | -0.344** | -0.435** | |
| 公共财政收入 | -0.508** | -0.484** | -0.444** | -0.528** | |
| 基础设施建设类 | 固定资产投资 | -0.274** | -0.193 | -0.412** | -0.312** |
| 年末金融机构各项贷款余额 | -0.360** | -0.286 | -0.391** | -0.365** | |
注:*P<0.05,**P<0.01。 |
Table 7 Changes in the difference of incomes between urban and rural residents in the APTZNC from 2000 to 2014表7 2000—2014年中国北方农牧交错带脱贫地区城乡居民收入差距变化(元,%) |
| 区域 | 城乡居民收入差 | 城乡居民收入差变化 | 城乡居民收入比 | 城乡居民收入比变化 | |||||||
|---|---|---|---|---|---|---|---|---|---|---|---|
| 2000年 | 2014年 | 2000—2014年变化量 | 变化率 | 2000年 | 2014年 | 2000—2014年变化量 | 变化率 | ||||
| 全区 | 4 455.27 | 13 868.90 | 9 413.62 | 211.29 | 3.14 | 2.93 | -0.21 | -6.69 | |||
| 东段 | 4 358.25 | 11 104.74 | 6 746.49 | 154.80 | 3.05 | 2.27 | -0.78 | -25.57 | |||
| 中段 | 4 802.01 | 13 291.92 | 8 489.91 | 176.80 | 3.29 | 3.01 | -0.28 | -8.51 | |||
| 西段 | 4 230.80 | 16 440.95 | 12 210.15 | 288.60 | 3.06 | 3.52 | 0.46 | 15.03 | |||
Table 8 Changes of the difference of per-capita incomes among the out-of-poverty counties in the APTZNC from 2000 to 2014表8 2000—2014年中国北方农牧交错带脱贫地区居民人均收入的差异变化 |
| 区域 | 变异系数 | 变异系数变化 | |||||
|---|---|---|---|---|---|---|---|
| 2000年 | 2010年 | 2014年 | 2000—2010年变化量 | 2010—2014年变化量 | 2000—2014年变化量 | ||
| 全区 | 0.24 | 0.36 | 0.34 | 0.12 | -0.02 | 0.10 | |
| 东段 | 0.18 | 0.17 | 0.18 | -0.01 | 0.01 | 0.00 | |
| 中段 | 0.23 | 0.29 | 0.24 | 0.06 | -0.05 | 0.01 | |
| 西段 | 0.27 | 0.46 | 0.45 | 0.19 | -0.01 | 0.18 | |
注:参考陈培阳等[57]的研究,本文采用各旗县人均收入的变异系数衡量不同旗县之间的人均收入差异。变异系数通过相应区域各旗县人均收入标准差和平均数的比计算。 |
The authors have declared that no competing interests exist.
| [1] |
国家统计局《中国城镇居民贫困问题研究》课题组. 中国城镇居民贫困问题研究[J]. 统计研究, 1991, (6): 12-18.
[The Research Group on the Poverty of Urban Residents in China, National Bureau of Statistics of China. Studies on the poverty of urban residents in China[J]. Statistical Studies, 1991, (6): 12-18. ]
|
| [2] |
[
|
| [3] |
|
| [4] |
|
| [5] |
|
| [6] |
[
|
| [7] |
[
|
| [8] |
[
|
| [9] |
[
|
| [10] |
[
|
| [11] |
国务院扶贫开发领导小组办公室. 国务院关于印发“十三五”脱贫攻坚规划的通知 [EB/OL]. (2016-12-03)[2017-09-01].
[The State Council Leading Group Office of Poverty Alleviation and Development. Notice of Issuance about the Poverty Alleviation Planning in China’s 13th Five-year Plan by the State Council [EB/OL]. (2016-12-03)[2017-09-01].
|
| [12] |
[
|
| [13] |
|
| [14] |
[
|
| [15] |
|
| [16] |
[
|
| [17] |
|
| [18] |
[
|
| [19] |
[
|
| [20] |
|
| [21] |
|
| [22] |
中华人民共和国中央人民政府. 《中国农村扶贫开发纲要(2001–2010年)》.[EB/OL]. (2001-08-20)[2017-09-01]
[ The State Council in the People’s Republic of China. China’s Rural Poverty Alleviation and Development Outline (2001-2010)[EB/OL]. (2001-08-20)[2017-09-01]. ]
|
| [23] |
|
| [24] |
[
|
| [25] |
|
| [26] |
[
|
| [27] |
[
|
| [28] |
[
|
| [29] |
国务院人口普查办公室. 中国2010年人口普查资料[M]. 北京: 中国统计出版社, 2012.
[National Population Census Office of China. China 2010 Population Census Data[M]. Beijing: China Statistics Press, 2012. ]
|
| [30] |
国务院人口普查办公室. 中国2000年人口普查资料 [M]. 北京: 中国统计出版社, 2002.
[National Population Census Office of China. China 2000 Population Census Data[M]. Beijing: China Statistics Press, 2002. ]
|
| [31] |
中国知识基础设施工程. 中国经济与社会发展统计数据库 [EB/OL]. (2015-12-01)[2017-09-01].
[National Knowledge Infrastructure of China. Statistical Database of Economic and Social Development [EB/OL]. (2015-12-01)[2017-09-01].
|
| [32] |
|
| [33] |
[
|
| [34] |
[
|
| [35] |
国家统计局. 中国区域经济统计年鉴-2001 [M]. 北京: 中国财政经济出版社, 2003.
[ National Bureau of Statistics of China. 2001 China Statistical Yearbook for Regional Economy[M]. Beijing: Chinese financial & Economic Publishing House, 2003. ]
|
| [36] |
国家统计局. 中国区域经济统计年鉴-2010 [M]. 北京: 中国统计出版社, 2011.
[National Bureau of Statistics of China. 2010 China Statistical Yearbook for Regional Economy[M]. Beijing: China Statistics Press, 2011. ]
|
| [37] |
国家统计局. 中国区域经济统计年鉴-2014 [M]. 北京: 中国统计出版社, 2015.
[National Bureau of Statistics of China. 2014 China Statistical Yearbook for Regional Economy [M]. Beijing: China Statistics Press, 2015. ]
|
| [38] |
国家基础地理信息中心. 中国矢量行政边界数据 [EB/OL]. (2015-12-01)[2017-09-01].
[National Geomatics Center of China. Administrative Boundaries Data in China [EB/OL]. (2015-12-01)[2017-09-01].
|
| [39] |
|
| [40] |
国家统计局. 中国统计年鉴-2015 [M]. 北京: 中国统计出版社, 2015.
[National Bureau of Statistics of China. 2015 China Statistical Yearbook [M]. Beijing: China Statistics Press, 2015. ]
|
| [41] |
|
| [42] |
[
|
| [43] |
[
|
| [44] |
|
| [45] |
|
| [46] |
[
|
| [47] |
|
| [48] |
|
| [49] |
中华人民共和国中央人民政府. 中国农村扶贫开发纲要(2011-2020年) [EB/OL]. (2011-12-15)[2017-09-01].
[The State Council in the People’s Republic of China. The State Council China’s Rural Poverty Alleviation and Development Outline (2011-2020) [EB/OL]. (2011-12-15)[2017-09-01].
|
| [50] |
|
| [51] |
|
| [52] |
|
| [53] |
|
| [54] |
|
| [55] |
|
| [56] |
[
|
| [57] |
[
|
| [58] |
[
|
| [59] |
[
|
| [60] |
[
|
| [61] |
国务院. 关于印发《建立精准扶贫工作机制实施方案》的通知 [EB/OL]. (2014-05-26)[2017-09-01].
[ The State Council. Notice of Issuance about the Suggestions about Poverty Alleviation in Rural Areas by the Innovation of Mechanism [EB/OL]. (2014-05-26)[2017-09-01].
|
| [62] |
国务院. 国务院扶贫办关于印发《扶贫开发建档立卡工作方案》的通知[EB/OL]. (2014-04-11)[2017-09-01].
[The State Council. Notice of Issuance about the Targeted Poverty Alleviation Measures [EB/OL]. (2014-04-11)[2017-09-01].
|
| [63] |
|
| [64] |
|
| [65] |
|
| [66] |
|
/
| 〈 |
|
〉 |