
Carbon emission measurement for China's logistics industry and its influence factors based on input-output method
Received date: 2017-05-23
Request revised date: 2017-07-26
Online published: 2018-01-20
Copyright
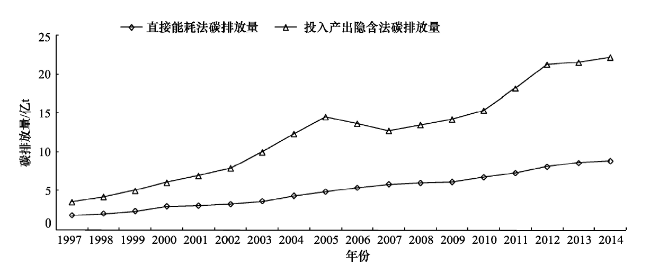
With great attention on energy conservation and emission reduction, the calculation and analysis of carbon emissions are becoming more important and urgent. Here, carbon emissions from direct energy consumption and implicit carbon emissions based on input-output table in China's logistics industry from 1997-2014 were calculated. We found that the former greatly underestimated the carbon emissions level of the logistics industry: since 2000 the contribution of indirect carbon emissions of the logistics industry has exceeded direct energy consumption carbon emissions. The proportion of direct carbon emissions accounting for total carbon emissions was less than 40% in 2014. Further carbon emission influence factor decomposition shows that the positive driving effect of economic scale on carbon emissions in the logistics industry is most, the total contribution rate is 36. 16%. Economic development of the service industry has led to an increase in carbon emissions in China's logistics industry, with a total contribution rate of 5. 21%. The use of low carbon technology is conducive to curb the carbon emissions increase, the total contribution rate of 26. 50%, but in recent years slow progress in low-carbon technology. The reverse driving effect of industry efficiency on carbon emissions in the logistics industry is obvious, but the effect is not stable. On the whole, the total contribution rate of industry efficiency on carbon emissions in the logistics industry is 21. 72% for 1997-2014. With rapid development of manufacturing, the service demand of the logistics industry will continue to increase in China and indirect carbon emissions growth should not be ignored. To realize the low carbon development of the logistics industry, we should accelerate the promotion of the use of clean energy, from the aspects of improving technical efficiency of the logistics and accelerating improvements in the low carbon levels of China's national economic departments.
Key words: logistics industry; carbon emissions; input output method; influence factors; China
WANG Liping , LIU Minghao . Carbon emission measurement for China's logistics industry and its influence factors based on input-output method[J]. Resources Science, 2018 , 40(1) : 195 -206 . DOI: 10.18402/resci.2018.01.18
Table 1 Carbon emissions of logistics industry based on direct energy consumption method from 1997 to 2014(万t)表1 1997—2014年基于直接能源消耗法的物流业碳排放量 |
| 年份 | 煤炭 | 焦炭 | 原油 | 汽油 | 煤油 | 柴油 | 燃料油 | 天然气 | 电力 | 碳排放总量 |
|---|---|---|---|---|---|---|---|---|---|---|
| 1997 | 1 944.5 | 18.0 | 711.3 | 5 096.9 | 1 876.8 | 6 228.8 | 2 639.5 | 10.7 | 30.6 | 18 557 |
| 1998 | 1 889.3 | 28.7 | 729.2 | 5 241.0 | 1 744.4 | 8 587.5 | 2 563.9 | 10.6 | 30.6 | 20 825 |
| 1999 | 1 758.4 | 28.2 | 732.0 | 5 451.7 | 2 258.8 | 10 031.1 | 3 808.1 | 13.8 | 30.5 | 24 113 |
| 2000 | 1 548.7 | 31.3 | 756.0 | 6 581.4 | 2 394.1 | 14 872.1 | 3 853.4 | 25.4 | 33.7 | 30 096 |
| 2001 | 1 427.7 | 32.5 | 733.4 | 6 739.1 | 2 504.8 | 15 446.3 | 3 876.1 | 31.6 | 37.0 | 30 829 |
| 2002 | 1 433.3 | 31.8 | 759.9 | 6 907.6 | 3 202.0 | 16 547.2 | 3 862.9 | 47.1 | 36.3 | 32 828 |
| 2003 | 1 450.1 | 30.0 | 640.5 | 8 250.1 | 3 313.4 | 18 671.1 | 4 262.8 | 54.2 | 48.7 | 36 721 |
| 2004 | 1 130.5 | 5.0 | 534.8 | 10 056.5 | 4 108.7 | 22 509.1 | 5 215.5 | 75.3 | 53.8 | 43 689 |
| 2005 | 1 107.7 | 3.0 | 547.9 | 10 468.3 | 4 254.8 | 26 596.1 | 5 716.8 | 109.4 | 51.5 | 48 856 |
| 2006 | 984.7 | 2.4 | 706.8 | 11 167.5 | 4 514.5 | 29 562.1 | 6 712.3 | 136.0 | 55.9 | 53 842 |
| 2007 | 931.3 | 1.5 | 706.8 | 11 257.2 | 5 048.1 | 32 438.5 | 7 978.6 | 134.9 | 63.7 | 58 561 |
| 2008 | 904.0 | 0.8 | 715.5 | 13 313.1 | 5 247.4 | 34 537.8 | 5 180.7 | 205.9 | 68.5 | 60 174 |
| 2009 | 870.7 | 0.4 | 662.6 | 12 413.4 | 5 871.3 | 35 633.4 | 5 669.7 | 262.1 | 73.9 | 61 458 |
| 2010 | 868.5 | 0.3 | 682.4 | 13 806.3 | 7 152.7 | 38 462.6 | 6 014.3 | 307.1 | 87.9 | 67 382 |
| 2011 | 877.5 | 0.3 | 455.2 | 14 532.6 | 7 355.0 | 42 827.1 | 6 098.2 | 398.2 | 102.0 | 72 646 |
| 2012 | 834.5 | 0.3 | 515.7 | 16 167.5 | 7 983.6 | 48 434.2 | 6 274.0 | 444.7 | 110.0 | 80 764 |
| 2013 | 836.1 | 6.2 | 642.4 | 18 876.1 | 8 926.7 | 49 307.8 | 6 478.2 | 506.0 | 120.0 | 85 699 |
| 2014 | 758.1 | 7.5 | 193.7 | 20 096.1 | 9 899.7 | 49 860.8 | 6 736.7 | 617.2 | 127.0 | 88 297 |
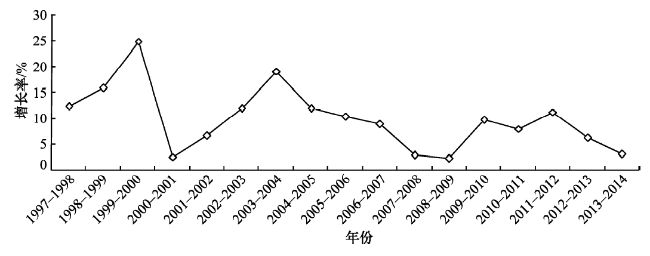
Figure 1 The carbon emissions growth rate of logistics industry based on direct energy consumption method图1 1997—2014年中国物流业直接能源消耗碳排放增长率 |
Table 2 The complete consumption coefficients of intermediate input department for logistics industry from 1997 to 2012表2 1997—2012年物流业对中间投入部门的完全消耗系数 |
| 行业 | 年份 | ||||||
|---|---|---|---|---|---|---|---|
| 1997 | 2000 | 2002 | 2005 | 2007 | 2010 | 2012 | |
| 1 | 0.067 | 0.091 | 0.081 | 0.130 | 0.066 | 0.072 | 0.076 |
| 2 | 0.097 | 0.144 | 0.169 | 0.181 | 0.237 | 0.247 | 0.335 |
| 3 | 0.490 | 0.648 | 0.532 | 0.708 | 0.569 | 0.571 | 0.748 |
| 4 | 0.049 | 0.089 | 0.067 | 0.168 | 0.107 | 0.098 | 0.164 |
| 5 | 0.094 | 0.196 | 0.206 | 0.299 | 0.274 | 0.256 | 0.307 |
| 6 | 0.102 | 0.141 | 0.113 | 0.380 | 0.136 | 0.146 | 0.199 |
| 7 | 0.026 | 0.029 | 0.023 | 0.018 | 0.006 | 0.007 | 0.015 |
| 8 | 0.066 | 0.079 | 0.171 | 0.215 | 0.119 | 0.148 | 0.248 |
| 9 | 0.079 | 0.085 | 0.098 | 0.103 | 0.073 | 0.079 | 0.114 |
| 10 | 0.097 | 0.120 | 0.164 | 0.215 | 0.143 | 0.134 | 0.190 |
Table 3 Carbon emissions comparison of the logistics industry based on two methods from 1997 to 2014表3 1997—2014年两种测算方法下的物流业碳排放量对比 |
| 年份 | 直接能耗法 碳排放量/万t | 投入产出隐含法碳排放量/万t | 前者占后者的 比重/% | ||
|---|---|---|---|---|---|
| 直接能耗法碳排放量 | 间接碳排放量 | 合计 | |||
| 1997 | 18 557 | 18 557 | 17 236 | 35 793 | 51.85 |
| 1998 | 20 825 | 20 825 | 21 709 | 42 534 | 48.96 |
| 1999 | 24 113 | 24 113 | 26 182 | 50 295 | 47.94 |
| 2000 | 30 096 | 30 096 | 30 655 | 60 751 | 49.54 |
| 2001 | 30 829 | 30 829 | 38 479 | 69 308 | 44.48 |
| 2002 | 32 828 | 32 828 | 46 302 | 79 130 | 41.49 |
| 2003 | 36 721 | 36 721 | 63 096 | 99 817 | 36.79 |
| 2004 | 43 689 | 43 689 | 79 891 | 123 580 | 35.35 |
| 2005 | 48 856 | 48 856 | 96 685 | 145 541 | 33.57 |
| 2006 | 53 842 | 53 842 | 82 881 | 136 723 | 39.38 |
| 2007 | 58 561 | 58 561 | 69 078 | 127 639 | 45.88 |
| 2008 | 60 174 | 60 174 | 74 956 | 135 130 | 44.53 |
| 2009 | 61 458 | 61 458 | 80 834 | 142 292 | 43.19 |
| 2010 | 67 382 | 67 382 | 86 711 | 154 093 | 43.73 |
| 2011 | 72 646 | 72 646 | 109 350 | 181 996 | 39.92 |
| 2012 | 80 764 | 80 764 | 131 989 | 212 753 | 37.96 |
| 2013 | 85 699 | 85 699 | 129 610 | 215 309 | 39.80 |
| 2014 | 88 297 | 88 297 | 133 766 | 222 063 | 39.76 |
Figure 2 Carbon emissions comparison of the logistics industry based on two calculation method from 1997 to 2014图2 1997—2014年两种测算方法下物流业碳排放量变化对比 |
Table 4 Contribution rate of driving factor for carbon emission of logistics industry from 1997 to 2014(%)表4 1997—2014年物流业碳排放驱动因素贡献率 |
| 年度区间 | 经济规模效应 | 服务业经济份额 | 物流业经济份额 | 行业效率效应 | 低碳技术效应 |
|---|---|---|---|---|---|
| 1997—1998 | 29.87 | 25.48 | 2.98 | 21.52 | 20.15 |
| 1998—1999 | 35.06 | 23.73 | 1.76 | 21.06 | 18.39 |
| 1999—2000 | 40.61 | 12.79 | 16.68 | 20.39 | 9.53 |
| 2000—2001 | 51.42 | 18.39 | 13.78 | 11.13 | 5.28 |
| 2001—2002 | 49.96 | 13.50 | 16.79 | 15.47 | 4.28 |
| 2002—2003 | 17.61 | 0.71 | 8.96 | 50.34 | 22.38 |
| 2003—2004 | 39.54 | 4.76 | 4.55 | 29.92 | 21.23 |
| 2004—2005 | 47.74 | 1.43 | 4.37 | 27.89 | 18.57 |
| 2005—2006 | 39.02 | 2.99 | 9.12 | 17.03 | 31.84 |
| 2006—2007 | 39.10 | 4.63 | 9.72 | 22.69 | 23.86 |
| 2007—2008 | 35.87 | 0.10 | 11.32 | 21.29 | 31.42 |
| 2008—2009 | 16.90 | 6.97 | 22.06 | 32.19 | 21.88 |
| 2009—2010 | 52.64 | 1.78 | 10.69 | 6.58 | 28.31 |
| 2010—2011 | 44.48 | 0.70 | 5.45 | 21.60 | 27.77 |
| 2011—2012 | 36.52 | 9.85 | 15.04 | 7.40 | 31.19 |
| 2012—2013 | 28.86 | 7.70 | 10.07 | 15.24 | 38.13 |
| 2013—2014 | 45.26 | 7.57 | 6.48 | 5.11 | 35.58 |
| 平均贡献率 | 38.26 | 8.42 | 9.99 | 20.40 | 22.93 |
| 总贡献率 | 36.16 | 5.21 | 10.42 | 21.72 | 26.50 |
数据来源:作者计算得出。 |
The authors have declared that no competing interests exist.
| [1] |
[
|
| [2] |
[
|
| [3] |
世界资源研究所, 世界可持续发展工商理事会, 中国标准化研究院. 温室气体核算体系: 产品寿命周期核算与报告标准[M]. 北京: 中国质检出版社, 2013.
[
|
| [4] |
|
| [5] |
|
| [6] |
[
|
| [7] |
[
|
| [8] |
[
|
| [9] |
|
| [10] |
|
| [11] |
|
| [12] |
[
|
| [13] |
[
|
| [14] |
[
|
| [15] |
[
|
| [16] |
[
|
| [17] |
中华人民共和国国家统计局. 中国统计年鉴2015[M]. 北京: 中国统计出版社, 2015.
[National Bureau of Statistics of China. China Statistical Yearbook 2015[M]. Beijing: China Statistics Press, 2015. ]
|
| [18] |
国家统计局能源司. 中国能源统计年鉴(1997-2016)[M]. 北京: 中国统计出版社, 2016.
[Energy Department of the National Bureau of Statistics. China Energy Statistical Yearbook (1997-2016)[M]. Beijing: China Statistics Press, 2016. ]
|
| [19] |
国家发展和改革委员会能源研究所课题组. 中国2050年低碳发展之路: 能源需求暨碳排放前景分析[M]. 北京: 科学出版社, 2010.
[Energy Research Institute National Development and Reform Commission. China's Road to Low Carbon Development in 2050: Energy Demand and Carbon Emission Analysis [M]. Beijing: Science Press, 2010. ]
|
| [20] |
国家统计局国民经济核算司. 中国投入产出表(1997-2012)[M]. 北京: 中国统计出版社, 2016.
[National Economic Accounting Department of the National Bureau of Statistics. Input-Output Tables of China (1997-2012)[M]. Beijing: China Statistics Press, 2016. ]
|
| [21] |
国民经济行业分类2017版[GB/T4754-2017]
|
| [22] |
[
|
| [23] |
|
| [24] |
|
| [25] |
|
| [26] |
[
|
/
| 〈 |
|
〉 |