
Spatio-temporal variation of resource and environmental pressure in China
Received date: 2017-02-08
Request revised date: 2017-07-11
Online published: 2017-10-20
Copyright
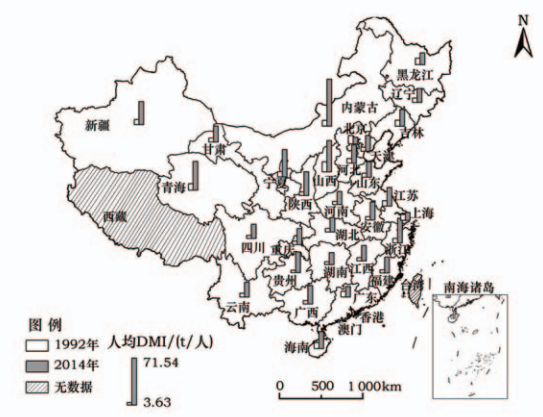
Direct material input(DMI)and domestic processed output(DPO)are the two main indicators in the economy-wide material flow analysis(EW-MFA)reflecting resource and environmental pressure in an economic system. To analyze spatial and temporal changes in China’s resource and environmental pressure,we calculated DMI per capita input and DPO per capita for 30 provinces in 1992 and 2014 based on EW-MFA. Results of this study show that resource and environmental pressures in these provinces have increased during the past 23 years. The northwest and middle reaches of Yellow River regions have the highest growth rate in resource and environmental pressure. These provinces have very large differences in resource and environmental pressure,which is obviously high in the northwest and low in the southeast. The northwest and middle reaches of Yellow River regions,such as Inner Mongolia,Shanxi,Qinghai and Ningxia have the highest resource and environmental pressure. Eastern areas such as Beijing,Shanghai,Tianjin and Guangdong,have the lowest resource and environmental pressure. This distribution is caused by large gaps in the resource endowment and industrial structure among provinces. Different regions in China have different resource and environmental problems. However,the northwest and middle reaches of Yellow River regions,and the northern and eastern coastal regions need to be improved to reduce high resource and environmental pressure and to realize sustainable development across China.
DAI Tiejun , WANG Wanjun , LIU Rui . Spatio-temporal variation of resource and environmental pressure in China[J]. Resources Science, 2017 , 39(10) : 1942 -1955 . DOI: 10.18402/resci.2017.10.13
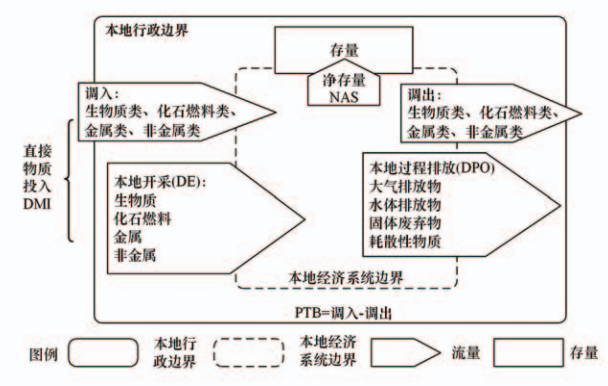
Figure 1 Economy-wide material flow analysis framework and indicator system图1 EW-MFA的基本核算框架与指标体系 |
Table 1 Conception and computational cormula of indicators used in this article表1 本文涉及的物质流指标及其计算公式 |
| 指标 | 含义 |
|---|---|
| 本地开采(DE) | 由本地开采并进入经济系统的物质,包括生物质、化石燃料、金属和非金属。 |
| 调入 | 由外地输送到本地的原材料、半成品和成品。 |
| 直接物质投入(DMI) | 进入经济系统的物质总量,DMI=DE+调入。 |
| 本地过程排放(DPO) | 经过生产和消费过程后排放到环境中的废弃物,包括大气排放物、水体排放物、固体废弃物和耗散性物质。 |
| 调出 | 由本地输送到外地的原材料、成品和半成品。 |
| 实物贸易平衡(PTB) | 经济系统的实物贸易盈余或赤字,PTB=调入-调出。 |
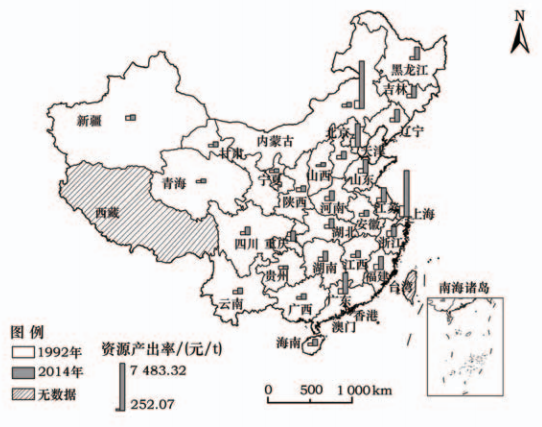
| 资源产出率 | 指消耗单位资源所创造的GDP,资源产出率=GDP/DMI |
Table 2 Material classification and data sources表2 物质分类、数据来源与估算方法 |
| 一级 | 二级 | 三级 | 数据来源 | 估算方法 |
|---|---|---|---|---|
| 本地开采 | 生物质 | 农作物 | 《中国农业年鉴(1993-2015)》[33] | 无 |
| 木材、竹材 | 《中国林业年鉴(1993-2015)》[34] | 无 | ||
| 水产品 | 《中国农业年鉴(1993-2015)》[33] | 无 | ||
| 已使用的农作物残余 | 《中国农业年鉴(1993-2015)》[33] | 估算,估算方法见参考文献[35] | ||
| 饲料作物和放牧生物 | 《中国农业年鉴(1993-2015)》[33] | 估算,估算方法见参考文献[35] | ||
| 化石燃料 | 原煤、原油、天然气 | 《中国能源统计年鉴(1991-2015)》[36] | 无 | |
| 金属 | 黑色金属、有色金属等 | 《中国矿业年鉴》[37]和各省份矿产资料 | 无 | |
| 非金属 | 冶金辅助材料类、化工原料类、黏土类,建筑类等 | 《中国矿业年鉴》[37]和各省份矿产资料 | 无 | |
| 混凝土用砂石 | 《中国统计年鉴(1993-2015)》[38] | 估算,估算方法见参考文献[39] | ||
| 本地过程排放 | 水体排放物 | 有机物、总氮、总磷、氨氮、石油类、挥发酚、重金属和氰化物 | 《中国环境年鉴(1993-2015)》[40] | 无 |
| 大气排放物 | SO2、工业烟粉尘 | 《中国环境年鉴(1993-2015)》[40] | 无 | |
| CO2 | 《中国能源统计年鉴(1991-2015)》[36] | 估算,估算方法见参考文献* | ||
| 固体废弃物 | 工业固废 | 《中国环境年鉴(1993-2015)》[40] | 无 | |
| 生活垃圾 | 《中国统计年鉴(1993-2015)》[38] | 估算,估算方法见参考文献[41,42] | ||
| 建筑垃圾 | 《中国统计年鉴(1993-2015)》[38] | 估算,估算方法见参考文献[43-45] | ||
| 耗散性物质 | 农药、农用化肥、农用薄膜 | 《中国农业年鉴(1993-2015)》[33] | 无 | |
| 有机肥 | 《中国农业年鉴(1993-2015)》[33] | 估算,估算方法见参考文献[32] |
注:* IPCC. 2006 IPCC Guidelines for National Greenhouse Gas Inventories:Volume 2. http://www.ipcc-nggip.iges.or.jp/public/2006gl/vol2.html. |
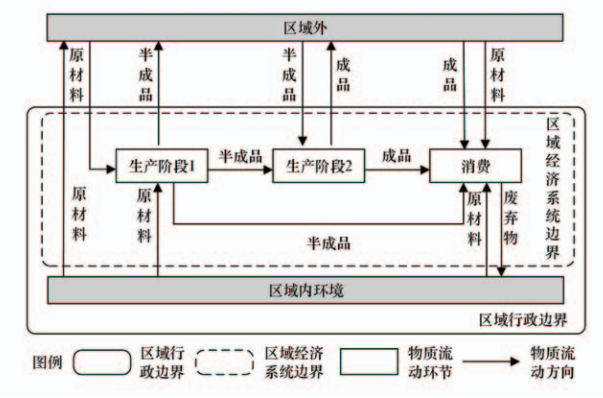
Figure 2 Calculating framework of regional imports and exports图2 区域调入调出核算框架 |
Figure 3 DMI per capita in 30 provinces of China in 1992 and 2014图3 1992年和2014年中国各省(自治区、直辖市)人均DMI |
Figure 4 Resource productivity in 30 provinces of China in 1992 and 2014图4 1992年和2014年中国各省(自治区、直辖市)资源产出率 |
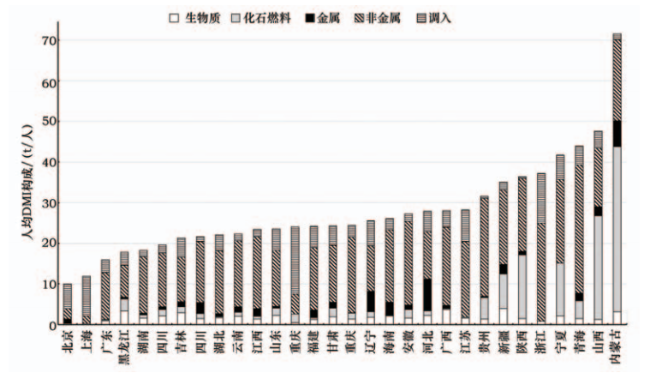
Figure 5 Scale and structure of DMI per capita in 30 provinces of China in 2014图5 2014年中国各省(自治区、直辖市)人均DMI的规模与构成 |
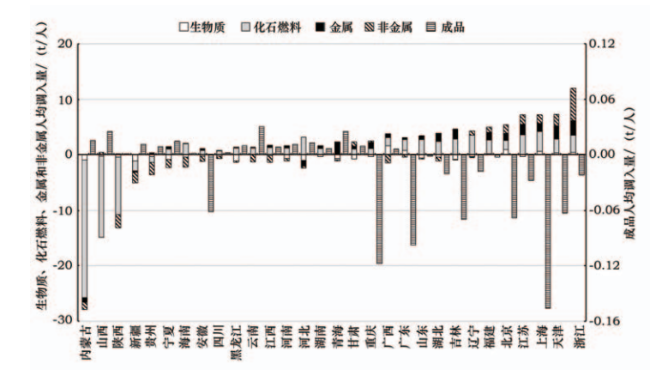
Figure 6 Scale and structure of PTB per capita in 30 provinces of China in 2014图6 2014年中国各省(自治区、直辖市)人均PTB的规模和构成 注:正数为调入,负数为调出。 |
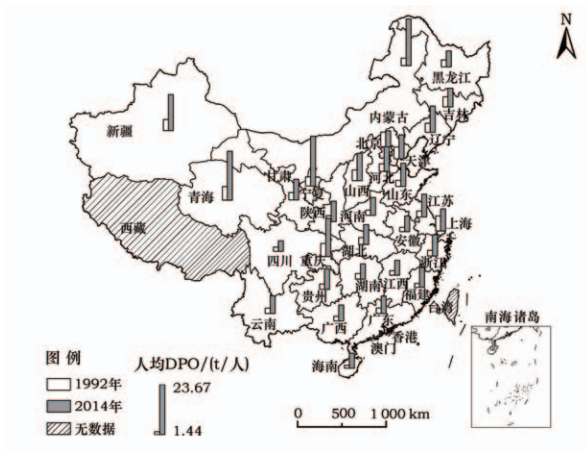
Figure 7 DPO per capita in 30 provinces of China in 1992 and 2014图7 1992年和2014年中国各省(自治区、直辖市)人均DPO |
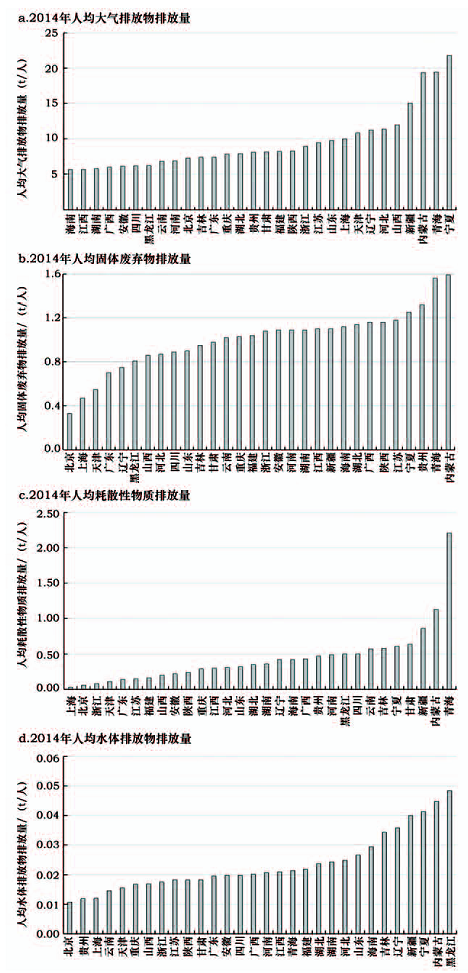
Figure 8 Per capita emissions for the four types of materials in 30 provinces of China in 2014图8 2014年中国各省份四种排放物人均排放量 |
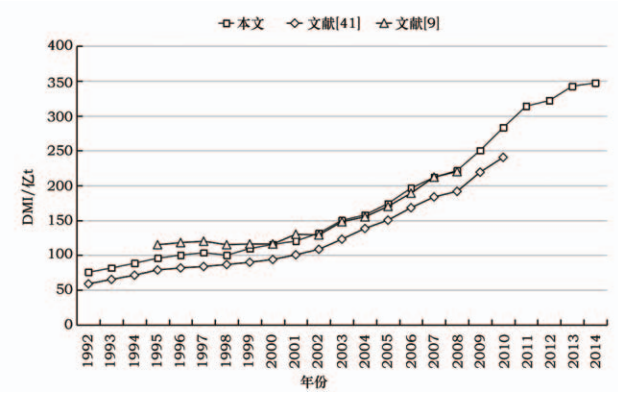
Figure 9 Comparison of the total DMI in 30 provinces of China with that in national level图9 中国各省(自治区、直辖市)DMI合计结果与其他研究的国家层面数据的比较 |
Table 3 Rankings of eight economic zones表3 八大经济区排名情况 |
| 经济区 | 人均DMI | 资源产出率 | 人均DPO | 总分 | ||||
|---|---|---|---|---|---|---|---|---|
| 1992年 | 2014年 | 1992年 | 2014年 | 1992年 | 2014年 | 1992年 | 2014年 | |
| 东北 | 8 | 2 | 4 | 4 | 7 | 4 | 19 | 12 |
| 北部沿海 | 3 | 4 | 3 | 3 | 6 | 6 | 15 | 13 |
| 东部沿海 | 7 | 6 | 1 | 2 | 5 | 5 | 13 | 13 |
| 南部沿海 | 6 | 1 | 2 | 1 | 1 | 3 | 9 | 5 |
| 黄河中游 | 4 | 8 | 8 | 7 | 4 | 7 | 16 | 22 |
| 长江中游 | 1 | 3 | 5 | 5 | 3 | 1 | 9 | 9 |
| 西北 | 5 | 7 | 7 | 8 | 8 | 8 | 20 | 23 |
| 西南 | 2 | 5 | 6 | 6 | 2 | 2 | 10 | 13 |
The authors have declared that no competing interests exist.
| [1] |
|
| [2] |
International Energy Agency. CO2 Emissions from Fuel Com-bustion:2015 Edition[M]. Paris:OECD/IEA,2015.
|
| [3] |
|
| [4] |
[
|
| [5] |
[
|
| [6] |
[
|
| [7] |
[
|
| [8] |
|
| [9] |
|
| [10] |
[
|
| [11] |
[
|
| [12] |
[
|
| [13] |
[
|
| [14] |
[
|
| [15] |
[
|
| [16] |
[
|
| [17] |
[
|
| [18] |
[
|
| [19] |
[
|
| [20] |
[
|
| [21] |
[
|
| [22] |
[
|
| [23] |
[
|
| [24] |
[
|
| [25] |
[
|
| [26] |
[
|
| [27] |
[
|
| [28] |
[
|
| [29] |
[
|
| [30] |
Eurostat. Economy Wide Material Flow Accounts and Derived Indicators-A Methodological Guide[M]. Luxembourg:Statistical Office of the European Union,2001.
|
| [31] |
OECD(Organization for Economic Cooperation and Development). Measuring Material Flows and Resource Productivity:Volume 1[M]. Paris:OECD,2008.
|
| [32] |
Eurostat. Economy Wide Material Flow Accounts:Compilation Guide 2013[M]. Luxembourg:European Statistical Office,2013.
|
| [33] |
中国农业年鉴编辑委员会. 中国农业年鉴[M]. 北京:中国农业出版社,1993-2015.
[Editorial Committee Of China Agriculture Yearbook. China Agriculture Yearbook[M].Beijing:China Agri-culture Press,1993-2015.]
|
| [34] |
国家林业局. 中国林业年鉴[M]. 北京:中国林业出版社,1993-2015.
[State Forestry Administration. China Forestry Yearbook[M]. Beijing:China Forestry Publishing House,1993-2015.]
|
| [35] |
[
|
| [36] |
国家统计局能源统计司. 中国能源统计年鉴[M]. 北京:中国统计出版社,1991-2015.
[Department of Energy Statistics, NBOS. China Energy Statistical Yearbook[M]. Beijing:China Statistics Press,1991-2015.]
|
| [37] |
中国矿业年鉴编辑部. 中国矿业年鉴[M]. 北京:地震出版社,2002-2015.
[Editorial office of China Mining Yearbook. China Mining Yearbook[M]. Beijing:Seismological Press,2002-2015.]
|
| [38] |
国家统计局. 中国统计年鉴[M]. 北京:中国统计出版社,1993-2015.
[National Bureau of Statistics of China. China Statistical Yearbook[M]. Beijing:China Statistics Press,1993-2015.]
|
| [39] |
UNEP International Resource Panel. Global Material Flows And Resource Productivity[R]. Paris:United Nations Environment Programme,2016.
|
| [40] |
中国环境年鉴编辑委员会. 中国环境年鉴[M]. 北京:中国环境年鉴社,1993-2015.
[Editorial Committee of China Environment Yearbook. China Environment Yearbook[M]. Beijing:China En-vironment Yearbook Press,1993-2015.]
|
| [41] |
[
|
| [42] |
[
|
| [43] |
[
|
| [44] |
[
|
| [45] |
[
|
| [46] |
[
|
| [47] |
[
|
| [48] |
[
|
| [49] |
[
|
| [50] |
[
|
| [51] |
国家统计局固定资产投资统计司. 中国建筑业统计年鉴[M]. 北京:中国统计出版社,1997-2015.
[Department of Investment and Construction Statistics of the National Bureau of Statistics. China Statistical Yearbook on Construction[M]. Beijing:China Statistics Press,1997-2015.]
|
| [52] |
[
|
| [53] |
[
|
| [54] |
国家经济贸易委员会,国家发展计划委员会,公安部,等. 摩托车报废标准暂行规定[J]. 道路交通管理,2002,(10):46-46.
[State Economic and Trade Commission,State Development Planning Commission,Ministry of Public Security,et al. Interim provisions on the scrap standard of motorcycles[J]. Road Traffic Manage,2002,(10):46-46.]
|
| [55] |
[
|
/
| 〈 |
|
〉 |