
Research on vulnerability and spatial differentiation on island economies on county level of China
Received date: 2017-03-24
Request revised date: 2017-09-06
Online published: 2017-09-20
Copyright
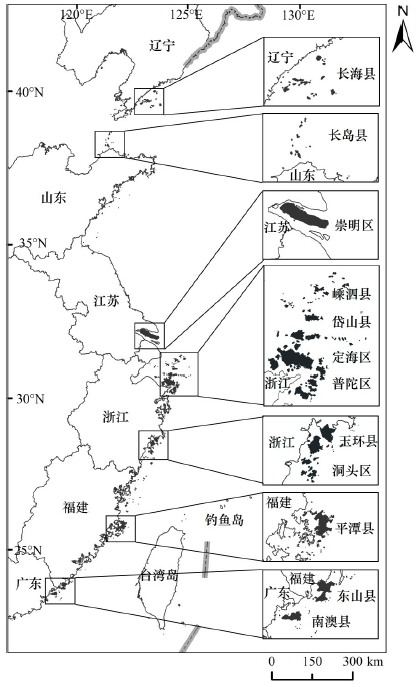
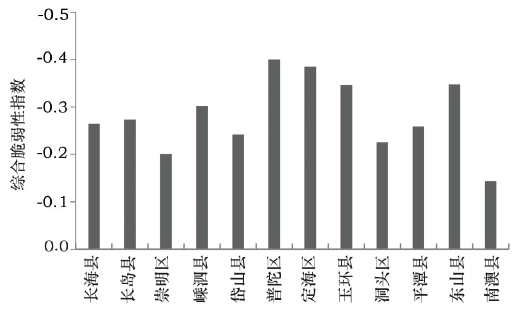
The island is a strategic bridgehead to develop and utilize marine resources and an important part of the human sea coupling system. With development of islands,ecological environmental problems gradually appear. Islands are facing unprecedented double pressure and challenges from the ecological environment and social development. Island economic vulnerability refers to an unsustainable state when the development of human-earth system in the island economy resists disturbances from various internal or external natural factors. Here we conducted island economic vulnerability assessments using a comprehensive index assessment method based on 38 parameters across five aspects(natural basis,resources,eco- environmental systems,economics and social development). In addition,standard values of measurements were established and used to evaluate overall island economic vulnerability and spatial differentiation. We found obvious differences in vulnerability across the 12 island counties and can be divided into four grades:Putuo District,Dinghai District,Yuhuan County and Dongshan County have low vulnerability;Shengsi County,Changdao County and Changhai County have weak vulnerability;Daishan County Pingtan County and Dongtou County have moderate vulnerability;and Chongming County and Nanao County have high vulnerability. Island economic vulnerability shows remarkable spatial differentiation regarding regionalization and clustered distribution. This study provides a scientific basis for the sustainable development of island economies and their reasonable development.
QIN Weishan , SUN Jianfeng , ZHANG Yifeng , LI Shitai . Research on vulnerability and spatial differentiation on island economies on county level of China[J]. Resources Science, 2017 , 39(9) : 1692 -1701 . DOI: 10.18402/resci.2017.09.08
Figure 1 Distribution of China’s island counties图1 中国海岛县分布 |
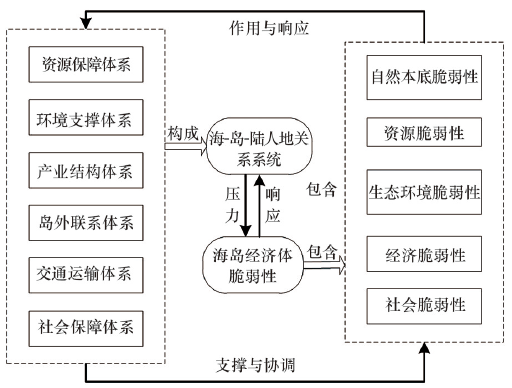
Figure 2 Basic framework for island economy vulnerability assessment图2 海岛经济体脆弱性评价基本框架 |
Table 1 Definition of vulnerability表1 脆弱性概念 |
| 侧重点 | 概念 | 研究学者 |
|---|---|---|
| 与自然灾害研究领域中的“风险”概念类似 | 个体或群体暴露于不利影响或遭受损害的可能性 | Dittmer B [23] |
| 强调一种 “度” | 指系统遭受不利影响或损害的响应程度 | Timmerman[2] |
| 强调一种“可能性” | 人们遭受外部有害物质威胁的可能性 | Gabor和Griffith[24] |
| 强调脆弱性的综合性 | 脆弱性是包含暴露、敏感性、恢复力的概念结合 | Adger[25] |
| 强调脆弱性是系统内部固有属性 | 系统对扰动的敏感性和应对能力的缺失而造成的系统结构和功能容易发生改变的一种属性 | 李鹤等[26] |
Table 2 Island economies evaluation index system表2 海岛经济体脆弱性指标体系 |
| 目标层 | 指标层 | 权重 | 性质 |
|---|---|---|---|
| 自然本底脆弱性 | 海岛离大陆最近距离/km | 0.19 | 正 |
| (0.22) | 海陆交通通达度指数 | 0.21 | 负 |
| 气象灾害受灾程度 | 0.23 | 正 | |
| 海岛平均坡度/度 | 0.11 | 正 | |
| 海岛区位指数 | 0.15 | 负 | |
| 海岛陆海面积系数/% | 0.11 | 负 | |
| 资源脆弱性 | 人均海域面积/km2 | 0.17 | 负 |
| (0.16) | 人均海岸线长度/km | 0.14 | 负 |
| 人均可利用土地面积/km2 | 0.13 | 负 | |
| 人均可支配电量/kW∙h | 0.15 | 负 | |
| 旅游资源丰富度/万元 | 0.18 | 负 | |
| 人均渔业资源/万元 | 0.12 | 负 | |
| 年均降水量/mm | 0.11 | 负 | |
| 生态环境脆弱性 | 沿海水域水质达标率/% | 0.15 | 负 |
| (0.20) | 污水处理率/% | 0.18 | 负 |
| 垃圾处理率/% | 0.18 | 负 | |
| 空气质量质优天数比例/% | 0.15 | 负 | |
| 植被覆盖率/% | 0.20 | 负 | |
| 海岛景观人工干扰指数/% | 0.14 | 正 | |
| 社会脆弱性 | 人口密度/(人/ km2) | 0.09 | 负 |
| (0.19) | 人口老龄化指数/% | 0.09 | 正 |
| 千人中学生在校人数/% | 0.11 | 负 | |
| 城市化率/% | 0.18 | 负 | |
| 千人医护人员数/人 | 0.14 | 负 | |
| 大专学历以上人数比例/% | 0.13 | 负 | |
| 互联网普及率/% | 0.16 | 负 | |
| 人均固定资产投资额/% | 0.10 | 负 | |
| 经济脆弱性 | 港口开发利用效率/万元 | 0.10 | 负 |
| (0.23) | 第三产业占GDP比例/% | 0.08 | 负 |
| 产业结构相似性系数/% | 0.07 | 正 | |
| 万元GDP电耗/kW∙h | 0.12 | 负 | |
| 城镇人口年可支配收入/元 | 0.09 | 负 | |
| 农村人口年可支配收入/元 | 0.08 | 负 | |
| 恩格尔系数/% | 0.07 | 正 | |
| 年度入岛旅游人数/万人 | 0.09 | 负 | |
| 进出口贸易总额/亿美元 | 0.17 | 负 | |
| 人均GDP/元 | 0.07 | 负 | |
| 实际吸引内外资总额/万人 | 0.06 | 负 |
Table 3 Vulnerability indexes of 12 island counties in 2016表3 2016年中国12个海岛经济体脆弱性指数 |
| 自然本底脆弱度 | 资源脆弱度 | 生态环境脆弱度 | 社会脆弱度 | 经济脆弱度 | 综合脆弱度 | |
|---|---|---|---|---|---|---|
| 长海县 | 0.090 4 | -0.538 4 | -0.426 9 | -0.314 6 | -0.229 0 | -0.264 1 |
| 长岛县 | 0.026 2 | -0.535 1 | -0.566 0 | -0.287 4 | -0.111 4 | -0.273 3 |
| 崇明县 | -0.208 6 | -0.287 7 | -0.107 6 | -0.261 9 | -0.161 4 | -0.200 4 |
| 嵊泗县 | 0.328 9 | -0.550 5 | -0.541 4 | -0.518 2 | -0.345 1 | -0.301 9 |
| 岱山县 | 0.144 5 | -0.302 5 | -0.493 8 | -0.419 8 | -0.201 2 | -0.241 4 |
| 普陀区 | -0.039 1 | -0.389 5 | -0.426 6 | -0.572 8 | -0.587 6 | -0.400 2 |
| 定海区 | -0.078 1 | -0.185 8 | -0.453 6 | -0.539 5 | -0.628 4 | -0.384 7 |
| 玉环县 | 0.104 9 | -0.357 2 | -0.544 6 | -0.554 3 | -0.427 0 | -0.346 5 |
| 洞头区 | 0.149 1 | -0.266 9 | -0.558 9 | -0.425 4 | -0.099 5 | -0.225 4 |
| 平潭县 | 0.014 2 | -0.123 7 | -0.510 2 | -0.551 8 | -0.152 8 | -0.258 7 |
| 东山县 | -0.003 1 | -0.624 9 | -0.700 0 | -0.409 3 | -0.128 1 | -0.347 9 |
| 南澳县 | 0.101 0 | -0.282 1 | -0.482 6 | -0.172 4 | 0.039 9 | -0.143 0 |
Table 4 Distribution of island counties with different grades in 2016表4 2016年中国海岛经济体脆弱性评价等级分布 |
| 海岛经济体脆弱性等级 | 一级(强脆弱度) | 二级(中脆弱度) | 三级(弱脆弱度) | 四级(低脆弱度) |
|---|---|---|---|---|
| 自然本底脆弱性 | 嵊泗县 | 洞头区、岱山县、玉环县、南澳县 | 长海县、长岛县、平潭县 | 东山县、普陀区、定海区、崇明县 |
| 资源脆弱性 | 平潭县、定海区 | 南澳县、洞头区、崇明区 | 普陀区、玉环县、岱山县 | 长岛县、长海县、嵊泗县、东山县 |
| 生态环境脆弱性 | 崇明区 | 普陀区、长海县、定海区、南澳县、岱山县 | 平潭县、嵊泗县、玉环县、洞头区、长岛县 | 东山县 |
| 社会脆弱性 | 南澳县、崇明区 | 长岛县、长海县、东山县 | 岱山县、洞头区嵊泗县 | 普陀区、玉环县、平潭县、定海区 |
| 经济脆弱性 | 南澳县、洞头区 | 长岛县、东山县、崇明区、平潭县 | 长海县、岱山县、嵊泗县 | 玉环县、普陀区、定海区 |
| 综合脆弱性 | 崇明区、南澳县 | 平潭县、岱山县、 洞头区 | 嵊泗县、长海县、长岛县 | 普陀区、定海区、东山县、玉环县 |
Figure 3 Comparison of 12 island counties vulnerability indexes in 2016图3 2016年中国12个海岛经济体脆弱性指数比较 |
The authors have declared that no competing interests exist.
| [1] |
|
| [2] |
|
| [3] |
|
| [4] |
|
| [5] |
[
|
| [6] |
[
|
| [7] |
[
|
| [8] |
[
|
| [9] |
[
|
| [10] |
[
|
| [11] |
[
|
| [12] |
[
|
| [13] |
[
|
| [14] |
|
| [15] |
[
|
| [16] |
[
|
| [17] |
[
|
| [18] |
[
|
| [19] |
[
|
| [20] |
[
|
| [21] |
[
|
| [22] |
[
|
| [23] |
|
| [24] |
|
| [25] |
|
| [26] |
[
|
| [27] |
[
|
| [28] |
[
|
| [29] |
[
|
| [30] |
[
|
| [31] |
[
|
| [32] |
[
|
| [33] |
中国国家统计局. 第六次全国人口普查[EB/OL]. (2012-02-28)[2017-03-10].
National Bureau of Statistics of the People’s Republic of China. Sixth Nationwide Population Census[EB/OL].(2012-02-28)[2017-03-10].
|
| [34] |
中国国家海洋局. 海洋环境公报[EB/OL]. (2016-06-14) [2017-03-10].
[State Oceanic Administration of the People’s Republic of China. Bulletin of Marine Environmental Conditions[EB/OL]. (2016-06-14)[2017-03-10].
|
/
| 〈 |
|
〉 |