
Chinese urban household metabolism accounting based on material flow analysis
Received date: 2017-02-10
Request revised date: 2017-07-08
Online published: 2017-09-20
Copyright
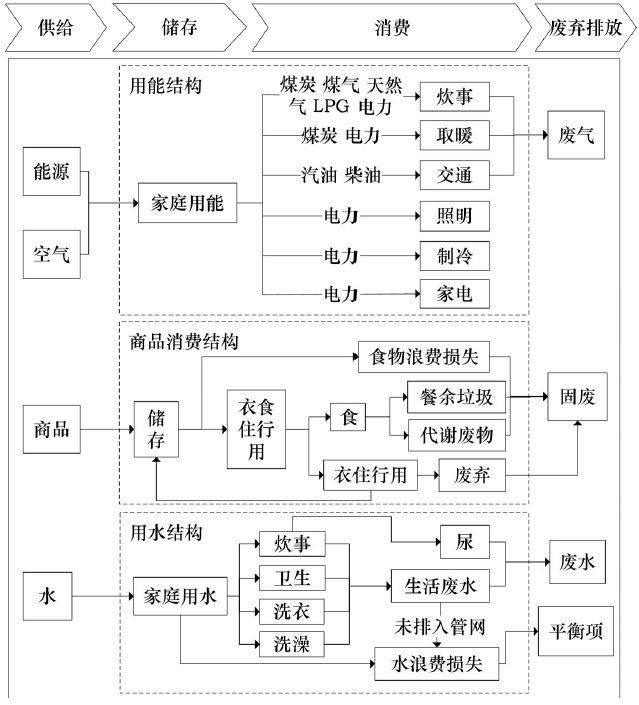
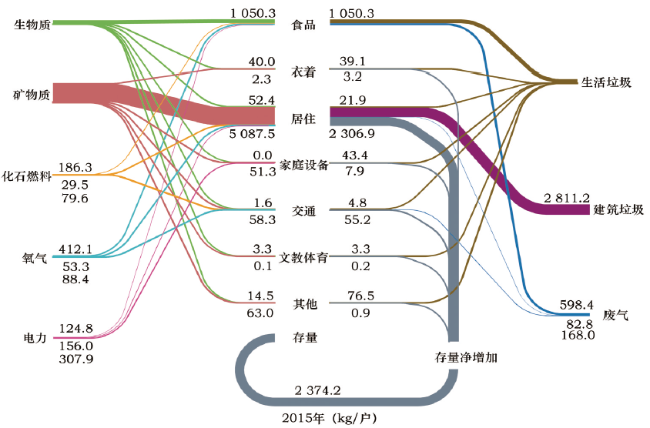
As research into sustainable consumption theory advances, urban households as the final consumption sector have become the main research focus in sustainable development. It is important and necessary to carry out ‘cell-scale’ environmental impact assessments at the urban household level. Based on Material Flow Accounting,we built an accounting framework for urban household material flow to provide a new focus for household-scale material flow analysis. We selected an average urban household as the system boundary,72 products and water and energy for household use as the research scope. We then measured input,output and stock of resource use of an average urban household in 2015. The concept of an average urban household originates from the China Statistic Yearbook 2016,and there are 2.90 persons per household. Results show that the direct material input (DMI)of an average urban household in 2015 was 86 420kg,and the material output was 83 457kg,thereby the net addition to stock (NAS)was 2374kg per household. As for material categories,water input accounted for the largest proportion,whereas the other 9% was important in total material input structure and deserved more attention and exploration. Mineral input fell into the second group,due to an increase in new residential buildings and purchase of durable goods. Biomass followed as the third,and food made the most contribution to biomass input. In terms of consumption categories,housing,food and transportation were the main sources of material input. For current urban household consumption,we present appropriate polices to encourage residents to change their unsustainable consumption concepts to sustainable household consumption patterns,such as consumption reduction,sharing economy,ecological design for products and green infrastructure.
YAN Li , LIU Jingru . Chinese urban household metabolism accounting based on material flow analysis[J]. Resources Science, 2017 , 39(9) : 1682 -1690 . DOI: 10.18402/resci.2017.09.07
Table 1 The consumption of an average urban household goods in 2015表1 2015年城镇家庭消费品户均消费量 |
| 产品 | 输入 | 输出 | 存量 | 产品 | 输入 | 输出 | 存量 | ||
|---|---|---|---|---|---|---|---|---|---|
| 食品 | 粮食/kg | 326.54 | 326.54 | 0.00 | 家庭设备 | 豆浆机/台 | 0.21 | 0.07 | 0.71 |
| 鲜菜/kg | 290.58 | 290.58 | 0.00 | 及用品 | 洗碗机/台 | 0.00 | 0.00 | 0.01 | |
| 植物油/kg | 32.19 | 32.19 | 0.00 | 消毒碗柜/台 | 0.02 | 0.02 | 0.20 | ||
| 猪肉/kg | 60.03 | 60.03 | 0.00 | 洗衣机/台 | 0.10 | 0.09 | 1.00 | ||
| 牛羊肉/kg | 11.31 | 11.31 | 0.00 | 电热水器/台 | 0.07 | 0.06 | 0.50 | ||
| 禽类/kg | 27.26 | 27.26 | 0.00 | 吸尘器/台 | 0.01 | 0.01 | 0.17 | ||
| 鲜蛋/kg | 42.63 | 42.63 | 0.00 | 太阳能热水器/台 | 0.03 | 0.02 | 0.20 | ||
| 水产品/kg | 30.45 | 30.45 | 0.00 | 剃须刀/台 | 0.08 | 0.07 | 0.29 | ||
| 鲜奶/kg | 49.59 | 49.59 | 0.00 | 电吹风机/台 | 0.04 | 0.04 | 0.19 | ||
| 鲜瓜果/kg | 159.79 | 159.79 | 0.00 | 洗澡用水/kg | 14 837.70 | 14 837.70 | 0.00 | ||
| 酒/kg | 19.90 | 19.90 | 0.00 | 家用电器用电/kWh | 810.32 | - | - | ||
| 炊事用水/kg | 19 855.60 | 19 855.60 | 0.00 | 取暖器/台 | 0.06 | 0.04 | 0.57 | ||
| 煤/kg | 7.38 | 7.38 | 0.00 | 冷暖风机/台 | 0.01 | 0.01 | 0.09 | ||
| 煤气/kg | 9.12 | 9.12 | 0.00 | 燃气热水器/台 | 0.04 | 0.03 | 0.30 | ||
| 天然气/kg | 99.34 | 99.34 | 0.00 | 手机/台 | 1.33 | 1.22 | 2.45 | ||
| 液化石油气/kg | 70.49 | 70.49 | 0.00 | 固定电话/台 | 0.99 | 1.05 | 0.49 | ||
| 电/kWh | 328.47 | 328.47 | 0.00 | 电脑/台 | 0.34 | 0.27 | 1.09 | ||
| 氧气/kg | 412.09 | 412.09 | 0.00 | 服务器/台 | 0.00 | 0.00 | 0.02 | ||
| 衣着 | 毛毯/件 | 0.35 | 0.34 | 1.61 | 计算器/台 | 0.00 | 0.05 | 0.04 | |
| 服装/件 | 29.11 | 26.30 | 84.51 | 彩色电视机/台 | 0.17 | 0.17 | 1.35 | ||
| 呢大衣/件 | 0.04 | 0.11 | 0.78 | 摄相机/台 | 0.02 | 0.01 | 0.12 | ||
| 毛皮大衣/件 | 0.17 | 0.15 | 0.93 | 组合音响/套 | 0.01 | 0.02 | 0.18 | ||
| 毛料服装/件 | 0.59 | 0.65 | 2.14 | 录音机/台 | 0.02 | 0.06 | 0.03 | ||
| 鞋子/双 | 9.34 | 8.90 | 18.47 | 录放相机/台 | 0.00 | 0.01 | 0.06 | ||
| 居住 | 住宅面积/m2 | 3.46 | 1.90 | 100.09 | 影碟机/台 | 0.08 | 0.05 | 0.97 | |
| 组合家具/套 | 0.12 | 0.10 | 0.96 | 照相机/架 | 0.04 | 0.03 | 0.51 | ||
| 沙发床/台 | 0.15 | 0.11 | 1.07 | 电子乐器/台 | 0.00 | 0.00 | 0.01 | ||
| 大衣柜/台 | 0.08 | 0.07 | 0.88 | 游戏机/台 | 0.04 | 0.03 | 0.40 | ||
| 写字台/张 | 0.17 | 0.17 | 0.82 | 电压力锅/台 | 0.08 | 0.04 | 0.30 | ||
| 沙发/台 | 0.01 | 0.04 | 1.69 | 洗衣用水/kg | 24 281.10 | 24 281.10 | 0.00 | ||
| 地毯/m2 | 0.26 | 0.25 | 1.50 | 交通通信 | 家用汽车/辆 | 0.05 | 0.00 | 0.30 | |
| 卫生用水/kg | 19 583.90 | 19 583.90 | 0.00 | 摩托车/辆 | 0.02 | 0.00 | 0.27 | ||
| 取暖用煤/kg | 29.54 | 29.54 | 0.00 | 汽油/kg | 61.28 | 61.28 | 0.00 | ||
| 取暖用电/kWh | 55.78 | - | - | 柴油/kg | 18.34 | 18.34 | 0.00 | ||
| 制冷用电/kWh | 220.01 | - | - | 自行车/辆 | 0.18 | 0.18 | 1.18 | ||
| 照明用电/kWh | 134.80 | - | - | 电动助力车/辆 | 0.09 | 0.06 | 0.46 | ||
| 氧气/kg | 53.28 | 53.28 | 0.00 | 氧气/kg | 88.35 | 88.35 | 0.00 | ||
| 家庭设备 | 电冰箱/台 | 0.14 | 0.13 | 1.02 | 文教娱乐 | 图书/本 | 13.28 | 12.62 | 57.47 |
| 及用品 | 空调器/台 | 0.21 | 0.14 | 1.47 | 服务其它 | 表/只 | 0.54 | 0.54 | 2.71 |
| 电风扇/台 | 0.31 | 0.32 | 1.66 | 缝纫机/台 | 0.00 | 0.00 | 0.24 | ||
| 排油烟机/台 | 0.09 | 0.08 | 0.69 | 电子体温计/支 | 0.02 | 0.01 | 0.09 | ||
| 电饭锅/台 | 0.33 | 0.28 | 1.57 | 健身器材/台 | 0.03 | 0.03 | 0.05 | ||
| 电炊具/台 | 0.28 | 0.24 | 1.51 | 玻璃制品/kg | 34.40 | 33.50 | 34.40 | ||
| 电水壶/台 | 0.08 | 0.04 | 0.31 | 卫生用纸/kg | 14.36 | 14.36 | 0.00 | ||
| 饮水机/台 | 0.12 | 0.09 | 0.75 | 洗涤用品/kg | 28.47 | 28.47 | 0.00 | ||
| 微波炉/台 | 0.24 | 0.22 | 0.67 |
注:1)表中空白处表示电力在家庭系统中只有输入,没有输出且没有存量。2)表中“0.00”表示该商品或服务在2015年内家庭没有购买,或没有输出,或没有存量。 |
Figure 1 The model of urban household material flow图1 城镇家庭物质流模型 |
Table 2 The indicators of urban household material flow accounting表2 城镇家庭物质流分析物质分类 |
| 物质分类 | 指标 | 核算内容 |
|---|---|---|
| 物质输入 | 总计 | 家庭购买的商品和新建建筑 |
| 生物质 | 食品,家具类,耐用品中的纸、木材 | |
| 矿物质 | 耐用品、建筑中的矿物材料 | |
| 燃料 | 生活能源 | |
| 氧气 | 生活能源燃烧需要的氧气投入 | |
| 水 | 家庭用水 | |
| 电力 | 家庭用电(折算成质量) | |
| 物质输出 | 总计 | 家庭排放到环境中的废弃物、排放物 |
| 固体废物 | 生活垃圾、废弃物、建筑垃圾 | |
| 废水 | 生活废水 | |
| 废气 | 生活能源燃烧产生的废气 | |
| 平衡项 | 未排入管网的污水,及浪费损失的水 | |
| 存量净增加 | 总计 | 家庭物质存量的增加量 |
| 生物质 | 家具类 | |
| 矿物质 | 耐用品、建筑 | |
| 存量 | 总计 | 主要为耐用品和住宅建筑 |
| 生物质 | 家具类 | |
| 矿物质 | 耐用品、建筑 |
Table 3 Material flow accounting system of urban household in 2015表3 2015年中国城镇家庭户均物质流账户体系(kg/户) |
| 总计 | 物质类别 | 小计 | 食品 | 衣着 | 居住 | 家庭设备及用品 | 交通通信 | 文教娱乐 | 其它 | |
|---|---|---|---|---|---|---|---|---|---|---|
| 输入量 | 86 420.92 | 生物质 | 1 162.13 | 1 050.27 | 40.02 | 52.43 | 0.03 | 1.59 | 3.32 | 14.46 |
| 矿物质 | 5 262.50 | 0.00 | 2.30 | 5 087.50 | 51.28 | 58.32 | 0.12 | 62.98 | ||
| 化石燃料 | 295.51 | 186.34 | 0.00 | 29.54 | 0.00 | 79.63 | 0.00 | 0.00 | ||
| 电力 | 588.76 | 124.82 | 0.00 | 156.02 | 307.92 | 0.00 | 0.00 | 0.00 | ||
| 水 | 78 558.30 | 19 855.60 | 0.00 | 19 583.90 | 39 118.80 | 0.00 | 0.00 | 0.00 | ||
| 氧气 | 553.72 | 412.09 | 0.00 | 53.28 | 0.00 | 88.35 | 0.00 | 0.00 | ||
| 小计 | 86 420.92 | 21 629.12 | 42.32 | 24 962.67 | 39 478.03 | 227.89 | 3.44 | 77.44 | ||
| 输出量 | 83 457.98 | 废水 | 64 431.70 | 17 851.20 | 0.00 | 15 539.80 | 31 040.70 | 0.00 | 0.00 | 0.00 |
| 平衡项 | 14 126.60 | 2 004.40 | 0.00 | 4 044.10 | 8 078.10 | 0.00 | 0.00 | 0.00 | ||
| 生活垃圾 | 1 239.25 | 1 050.27 | 39.12 | 21.86 | 43.43 | 4.76 | 3.27 | 76.54 | ||
| 建筑垃圾 | 2 811.20 | 0.00 | 0.00 | 2 811.20 | 0.00 | 0.00 | 0.00 | 0.00 | ||
| 废气 | 849.23 | 598.43 | 0.00 | 82.82 | 0.00 | 167.98 | 0.00 | 0.00 | ||
| 小计 | 83 457.98 | 21 504.30 | 39.12 | 22 499.78 | 39 162.23 | 172.74 | 3.27 | 76.54 | ||
| 存量净增加 | 2 374.08 | 生物质 | 19.38 | 0.00 | 3.09 | 14.77 | 0.01 | 1.35 | 0.17 | 0.00 |
| 矿物质 | 2 354.69 | 0.00 | 0.11 | 2 292.00 | 7.88 | 53.81 | 0.00 | 0.90 | ||
| 小计 | 2 374.08 | 0.00 | 3.20 | 2 306.77 | 7.88 | 55.15 | 0.17 | 0.90 | ||
| 存量 | 149 162.75 | 生物质 | 1 226.95 | 0.00 | 112.25 | 1 089.06 | 0.16 | 10.57 | 14.37 | 0.54 |
| 矿物质 | 147 935.80 | 0.00 | 4.54 | 147 167.70 | 332.42 | 388.05 | 0.18 | 42.90 | ||
| 小计 | 149 162.75 | 0.00 | 116.80 | 148 256.76 | 332.58 | 398.62 | 14.55 | 43.44 |
Figure 2 Material metabolism and balance of an average urban household in 2015图2 2015年中国城镇家庭物质代谢平衡 |
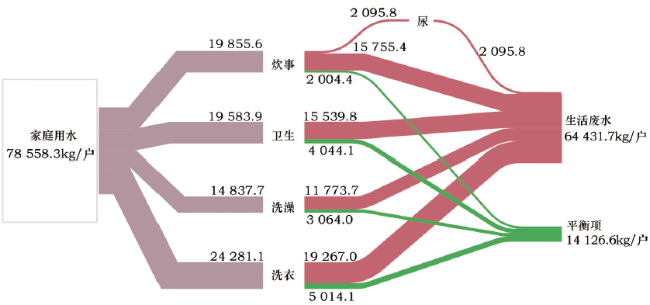
Figure 3 Water metabolism of an average urban household in 2015图3 2015年中国城镇家庭水代谢过程 |
The authors have declared that no competing interests exist.
| [1] |
|
| [2] |
|
| [3] |
|
| [4] |
United Nations Department of Economic and
|
| [5] |
|
| [6] |
[
|
| [7] |
[
|
| [8] |
|
| [9] |
|
| [10] |
|
| [11] |
[
|
| [12] |
[
|
| [13] |
[
|
| [14] |
[
|
| [15] |
[
|
| [16] |
[
|
| [17] |
中华人民共和国国家统计局. 2016中国统计年鉴[M]. 北京:中国统计出版社,2016.
[National Bureau of Statistics of the People’s Republic of China. 2016 China Statistical Yearbook[M]. Beijing:China Statistics Press,2016.]
|
| [18] |
国家发展和改革委员会. 废弃电器电子产品处理目录(2013)[M]. 北京:社会科学文献出版社,2015.
[
|
| [19] |
国家统计局城市社会经济调查司. 2015中国城市建设统计年鉴[M]. 北京:中国统计出版社,2016.
[National Bureau of Statistics of the People’s Republic of China. 2015 China Urban Construction Statistical Yearbook[M]. Beijing:China Statistics Press,2016.]
|
| [20] |
国家统计局能源统计司. 中国能源统计年鉴2016[M]. 北京:中国统计出版社,2016.
[
|
| [21] |
[
|
| [22] |
[
|
| [23] |
|
| [24] |
[
|
| [25] |
[
|
| [26] |
[
|
/
| 〈 |
|
〉 |