
Landscape visual quality assessment based on eye movement:college student eye-tracking experiments on tourism landscape pictures
Received date: 2017-02-10
Request revised date: 2017-03-05
Online published: 2017-06-20
Copyright
Landscape visual quality assessment is the basis of rational planning,development,utilization and protection of tourism resources. Various assessment methods have their own advantages,but many deficiencies. Most existing evaluation methods are subjectively qualitative approaches. Here,we introduce eye-tracking analysis to landscape visual quality assessment using the rural tourism destination Hongcun as a case study. An eyetracker was used to record eye movement data while subjects looked at Hongcun landscape pictures. We combined SBE and SD to obtain the subjective evaluation of landscape visual quality,which were analyzed by correlation and regression analysis with eye movement index data. We found that subjects had different eye movement characteristics in four landscapes types,among which,there were significant differences in fixation frequency,average fixation duration and saccade frequency. The fixation points mainly focused on the main buildings,some prominent elements and the borders of landscape elements. The subjective evaluation of landscape visual quality was significantly correlated with fixation frequency,percentage of fixation duration, average fixation duration and percentage of saccade duration. The eye movement evaluation model of landscape visual quality was built. Visual quality values of four landscape types in Hongcun, settlement, ecology, agriculture and culture, calculated by the model, were 5.99, 5.98, 5.96 and 5.90. The model shows that a higher fixation frequency and a longer watching time(a lower percentage of fixation duration) produce a higher landscape visual quality assessment of tourism landscapes. Our method is a new tool to conduct landscape visual quality assessments.
GUO Suling , ZHAO Ningxi , ZHANG Jianxin , XUE Ting , LIU Peixue , XU Shuai , XU Dandan . Landscape visual quality assessment based on eye movement:college student eye-tracking experiments on tourism landscape pictures[J]. Resources Science, 2017 , 39(6) : 1137 -1147 . DOI: 10.18402/resci.2017.06.13
Table 1 Basic meaning of eye movement indexes表1 眼动指标基本意义 |
| 眼动指标 | 简写 | 基本意义 |
|---|---|---|
| 注视频率/(次/s) | FF | 注视次数与注视时间之比,反映评价区域受重视程度的指标,注视频率高则表示被试对图片感觉重要或较为感兴趣 |
| 注视时间比重 | PFD | 注视总时间与观察总时间的比值,注视时间比重越小,说明被试对图片的观察时间相对较长而注视总时间相对较短 |
| 平均注视时间/(ms) | AFD | 被试对每个注视点停留的平均时间,被试对图片认知越努力,其在注视点停留的平均时间就越长。 |
| 眼跳频率/(次/s) | SF | 单位时间内的眼跳次数,能够反映被试的搜素行为。在信息搜索过程中眼动频率高表明被试的搜索量大,其所观察的图片的特征不鲜明 |
| 眼跳时间比重 | PSD | 眼跳总时间与观察总时间的比值,反映被试在选取注视点上所用的时间 |
| 平均眼跳幅度/度 | ASA | 反映获取信息的范围。平均眼跳幅度越大表示图片特征越鲜明,被试能够直接到达目标区 |
| 平均眼跳速度/(度/s) | ASV | 评价被试获取信息范围大小的指标,反映图片信息的鲜明特征 |
Table 2 Subjective evaluation system indexes weight of landscape visual quality表2 景观视觉质量主观评价体系指标权重 |
| 指标 | 自然性(N) | 多样性(D) | 协调性(H) | 奇特性(S) | 有序性(O) | 生动性(V) | 文化性(C ) | 宜人性(A) |
|---|---|---|---|---|---|---|---|---|
| 权重 | 0.17 | 0.18 | 0.17 | 0.04 | 0.08 | 0.17 | 0.07 | 0.12 |
Table 3 Differential analysis of eye movement indexes in landscape types表3 不同景观类型眼动指标差异分析 |
| 眼动指标 | FF | PFD | AFD | SF | PSD | ASA | ASV |
|---|---|---|---|---|---|---|---|
| 总体差异(sig.) | 0.000* | 0.981 | 0.034* | 0.003* | 0.470 | 0.111 | 0.747 |
| 景观类型间差异 | |||||||
| 聚落景观(a) | 2.54d | 0.84 | 355.91 | 2.44d | 0.07 | 2.65 | 84.00 |
| 生态景观(b) | 2.57d | 0.85 | 360.86 | 2.43d | 0.07 | 2.86 | 86.47 |
| 农业景观(c) | 2.47d | 0.85 | 406.60 | 2.30d | 0.06 | 2.41 | 82.24 |
| 文化景观(d) | 2.21abc | 0.85 | 424.48 | 2.08abc | 0.07 | 3.97 | 88.48 |
注:*表示在0.05水上具有显著差异;文化景观中2.21abc,2.21表示文化景观的注视频率均值,abc表示文化景观与聚落景观、生态景观、农业景观有显著差异,其他值解释方式与此相同。 |
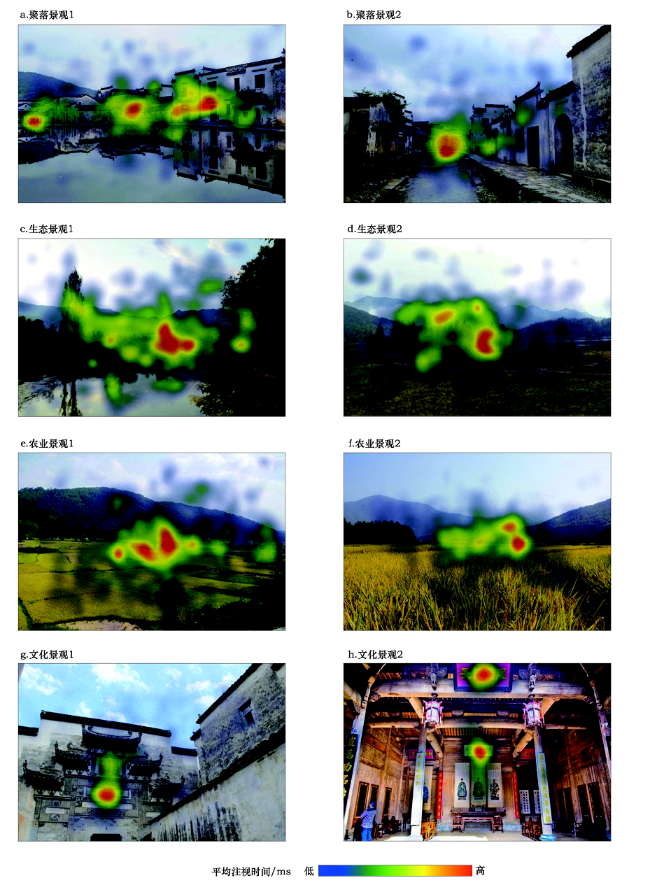
Figure 1 Heat maps of four kinds of landscape pictures图1 四类景观的热点图 |
Table 4 Correlation analysis between eye movement indexes and subjective evaluation value of landscape visual quality表4 景观视觉质量主观评价值与眼动指标相关性分析 |
| FF | PFD | AFD | SF | PSD | ASA | ASV | ||
|---|---|---|---|---|---|---|---|---|
| VQ | Pearson相关性 | 0.105* | -0.127** | -0.113* | 0.075 | 0.101* | 0.033 | 0.072 |
| 显著性 | 0.023 | 0.006 | 0.014 | 0.102 | 0.028 | 0.469 | 0.119 | |
| N | 472 | 472 | 472 | 472 | 472 | 472 | 472 |
注:**、*分别表示在0.01、0.05水平(双侧)上显著相关。 |
Table 5 Eye movement evaluation model coefficients by regression analysis表5 眼动评价模型回归系数分析 |
| 非标准化系数 | 标准系数 | t | Sig. | |||
|---|---|---|---|---|---|---|
| B | 标准误差 | 试用版 | ||||
| 模型1 | (常量) | 6.899 | 0.347 | 19.889 | 0.000 | |
| 注视时间比重 | -1.120 | 0.402 | -0.127 | -2.786 | 0.006 | |
| 模型2 | (常量) | 6.455 | 0.383 | 16.851 | 0.000 | |
| 注视时间比重 | -1.248 | 0.402 | -0.142 | -3.101 | 0.002 | |
| 注视频率 | 0.226 | 0.085 | 0.122 | 2.658 | 0.008 | |
Table 6 The tested pictures’ score of subjective evaluation and forecast evaluation表6 检验图片的主观评价与预测评价得分 |
| 景观类型 | 主观评价得分 | 预测评价得分 |
|---|---|---|
| 聚落景观 | 5.85 | 6.01 |
| 生态景观 | 6.98 | 5.96 |
| 农业景观 | 5.81 | 5.96 |
| 文化景观 | 5.98 | 5.96 |
The authors have declared that no competing interests exist.
| [1] |
[
|
| [2] |
[
|
| [3] |
|
| [4] |
[
|
| [5] |
[
|
| [6] |
|
| [7] |
|
| [8] |
[
|
| [9] |
[
|
| [10] |
[
|
| [11] |
[
|
| [12] |
|
| [13] |
|
| [14] |
|
| [15] |
|
| [16] |
|
| [17] |
[
|
| [18] |
[
|
| [19] |
|
| [20] |
|
| [21] |
[
|
| [22] |
[
|
| [23] |
[
|
| [24] |
[
|
| [25] |
[
|
| [26] |
[
|
| [27] |
[
|
| [28] |
|
| [29] |
|
| [30] |
|
| [31] |
|
| [32] |
|
| [33] |
[
|
| [34] |
[
|
| [35] |
[
|
| [36] |
[
|
| [37] |
[
|
| [38] |
|
| [39] |
[
|
| [40] |
[
|
| [41] |
[
|
| [42] |
蚂蜂窝旅游网[EB/OL].[2016-3-20]
[Mafengwo[EB/OL].[2016-3-20].
|
| [43] |
[
|
| [44] |
[
|
| [45] |
|
| [46] |
[
|
| [47] |
[
|
| [48] |
[
|
| [49] |
[
|
| [50] |
[
|
/
| 〈 |
|
〉 |