
The characteristics of extreme minimum temperature events and exposure of farmland in China
Received date: 2016-11-10
Request revised date: 2017-01-09
Online published: 2017-05-20
Copyright
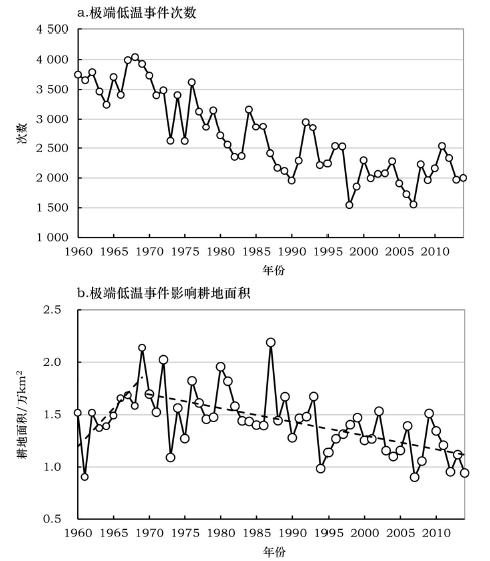
Based on daily minimum temperature data from 543 meteorological stations from 1960 to 2014,characteristics of extreme minimum temperature events over China were analyzed. By taking the spatial and temporal continuity characteristics of extreme minimum temperature events into account,the Intensity-Area-Duration(IAD)method was applied to assess the relationship between intensity and coverage of extreme minimum temperature events at different durations and evaluate the area of farmland exposed to extreme minimum temperature events. We found that the areas where single-site extreme minimum temperature events occur more frequently are located in the northern and northeastern regions and that most events last 1~2 days. In northwestern and southeastern areas,where extreme minimum temperature events are comparatively lesser,most events last longer (last 3~5 days,or more than six days). Coverage of extreme minimum temperature events has decreased from the 1960s to 1990s,and increased in the 21st century. The coverage of extreme minimum temperature events was lowest in the 1990s for different durations. Before the 21st century,regional extreme minimum temperature events were of short duration but greater area and intensity. Since the beginning of the 21st century,both the coverage and intensity of extreme minimum temperature events has decreased,but the duration has increased. The area of farmland exposed to extreme minimum temperature events increased before 1969,but then decreased. The maximum and minimum farmland area exposed to extreme minimum temperature events was in 1969 and 2007 respectively. Farmland area exposed to extreme minimum temperature events has stabilized since the beginning of the 21st century.
WANG Anqian , SU Buda , WANG Yanjun , WANG Guojie , HUANG Jinlong , ZHAO Chengyi . The characteristics of extreme minimum temperature events and exposure of farmland in China[J]. Resources Science, 2017 , 39(5) : 954 -963 . DOI: 10.18402/resci.2017.05.15
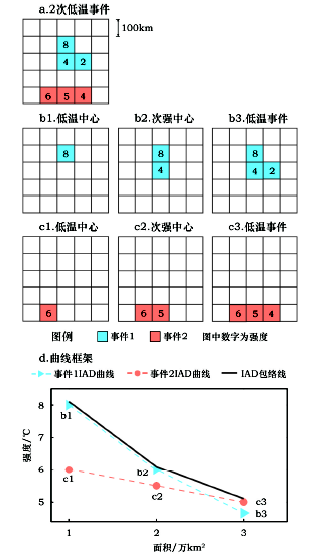
Figure 1 Construction of the Intensity-Area-Duration(IAD)curve图1 强度-面积-持续时间(IAD)曲线框架 |
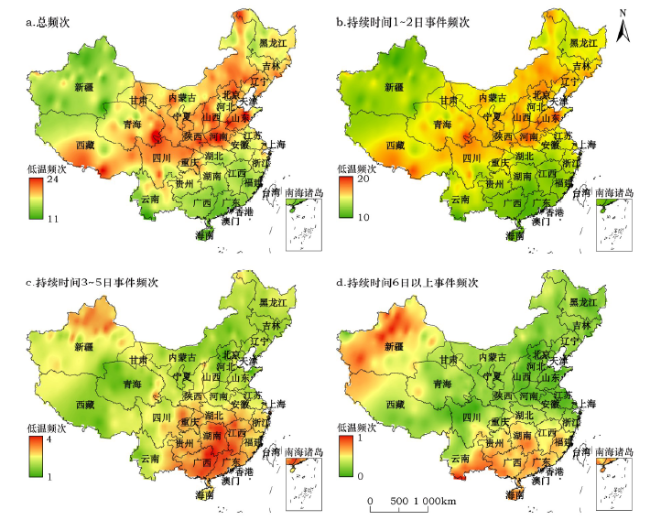
Figure 2 Spatial distribution of the frequency of single-site extreme minimum temperature events over China for the period from 1960 to 2014图2 1960-2014年气象站极端低温事件年均频次空间分布 |
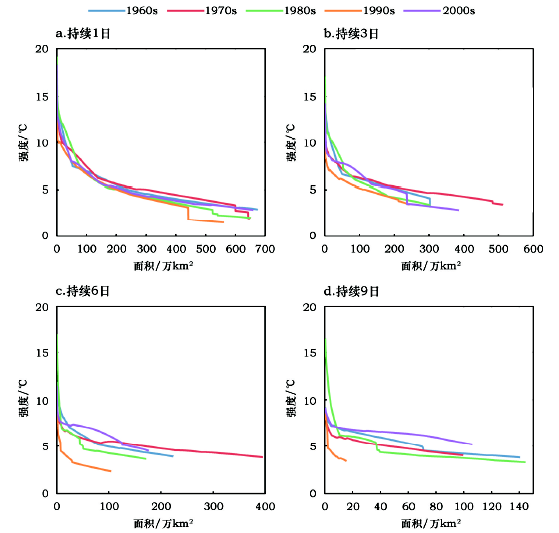
Figure 3 IAD envelope of the different durations (1d,3d,6d,9d)extreme minimum temperature events in different period from 1960 to 2014图3 各时间段内不同持续时间(1日、3日、6日、9日)极端低温事件IAD包络线 |
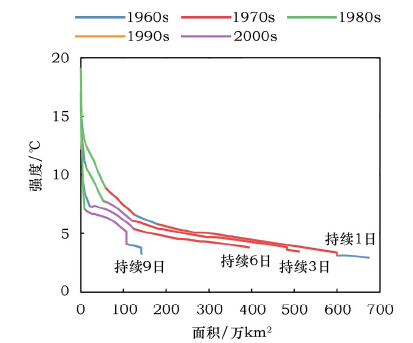
Figure 4 IAD envelope of the different durations(1d,3d,6d,9d)extreme minimum temperature events from 1960 to 2014 in China图4 1960-2014年不同持续时间(持续1日、3日、6日及9日)极端低温事件IAD 包络线 |
Figure 5 Frequency of extreme minimum temperature events from 1960 to 2014 and farmland area affected by the extreme minimum temperature events (based on the 2000 land use data)图5 1960-2014年极端低温事件的次数及极端低温事件影响的耕地面积(以2000年土地利用为基准) |
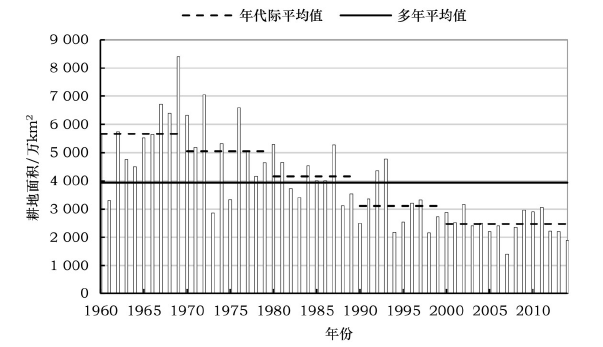
Figure 6 Annual cumulative farmland impacted by the extreme minimum temperature events from 1960 to 2014(based on the 2000 land use data;dotted line denotes the multi-year average)图6 1960-2014年极端低温事件累积影响的耕地面积(以2000年土地利用为基准,虚线为平均值) |
The authors have declared that no competing interests exist.
| [1] |
WMO.2010:Report of the Meeting of the Management Group of the Commission for Climatology[EB/OL]. (2010-03-18)[2016-11-10].
|
| [2] |
[
|
| [3] |
|
| [4] |
|
| [5] |
[
|
| [6] |
|
| [7] |
|
| [8] |
|
| [9] |
|
| [10] |
|
| [11] |
|
| [12] |
|
| [13] |
|
| [14] |
|
| [15] |
|
| [16] |
|
| [17] |
|
| [18] |
[
|
| [19] |
[
|
| [20] |
[
|
| [21] |
[
|
| [22] |
[
|
| [23] |
[
|
| [24] |
|
| [25] |
[
|
| [26] |
[
|
| [27] |
[
|
| [28] |
[
|
| [29] |
[
|
| [30] |
|
| [31] |
[
|
| [32] |
[
|
| [33] |
国家气象信息中心. 中国地面气候资料日值数据集(V3.0)[EB/OL]. (2012-11-22)[2015-09-15].
[National Meteorological Information Center. Daily Ground Climate Data Set in China, Version 3.0[EB/OL]. (2012-11-22)[2015-09-15].
|
| [34] |
|
| [35] |
|
| [36] |
|
/
| 〈 |
|
〉 |