
Potential and regional distribution for the energy utilization of crop residues in China
Received date: 2016-03-01
Request revised date: 2017-02-09
Online published: 2017-03-20
Copyright
There are redundant crop residual resources in China and so developing crop residues as biomass energy shows great economic and ecological promise. For the efficient utilization of field crop residues,it is necessary to evaluate the potential and regional distribution of commercial production of field crop residues. First,we employed the yields of various crops in different provinces to calculate the theoretical amount of crop residue and the potential for commercial energy production. Remote-sensing data was mobilized to obtain NPP at a 1 km × 1 km grid level and distribution density of crop residue in different grids,and then suitability distribution of bioenergy plants in different regions was achieved. Compared to previous research,we considered the distribution density of crop residue in different regions because this is important to the use of crop residues which face high collection and transportation costs. We also analyzed the development trend of the distribution of crop residues and energy plants by comparing different years. Our results show that China’s total output of crop residues in 2014 amounted to 0.897 billion ton,collectable amount of crop residue amounted to 0.769 billion ton. Based on the consideration of resources density,larger-scale power plants and fuel ethanol plants are suitable for Jilin,Jiangsu,Henan,Anhui and Heilongjiang Provinces. In the future,China’s crop residue resources and energy plants will be concentrated in these areas. Small-scale power plants and fuel ethanol plants are suitable for Northeast China,Northern China,Southwest China,Middle and Lower Reaches of the Yangtze River,Chengdu Plain and Xinjiang. Government should support the energy utilization of crop residues and distribute energy plants according to crop residue density and scale.
ZHANG Chongshang , LIU Le , LU Qinan , XU Xinliang , QIU Huanguang . Potential and regional distribution for the energy utilization of crop residues in China[J]. Resources Science, 2017 , 39(3) : 473 -481 . DOI: 10.18402/resci.2017.03.09
Table 1 Residue to product ratio and collection coefficients of crop residues表1 各农作物草谷比系数、可收集系数取值 |
| 农作物 | 草谷比系数 | 收集系数 |
|---|---|---|
| 水稻 | 0.90 | 0.75 |
| 小麦 | 1.16 | 0.74 |
| 玉米 | 1.75 | 0.95 |
| 薯类 | 0.70 | 0.8 |
| 其他粮食作物 | 1.17 | 0.8 |
| 高粱 | 1.65 | 0.8 |
| 豆类 | 1.54 | 0.88 |
| 花生 | 1.94 | 0.88 |
| 油菜 | 2.04 | 0.89 |
| 芝麻 | 2.04 | 0.88 |
| 向日葵 | 2.04 | 0.88 |
| 胡麻 | 2.04 | 0.88 |
| 麻类 | 2.50 | 0.87 |
| 棉花 | 3.44 | 0.9 |
| 甘蔗 | 0.23 | 0.88 |
Table 2 Results of crop residue by regions in 2014表2 2014年各地区秸秆资源量计算结果 |
| 地区 | 可能源化利用比例 /% | 2014年秸秆资源量/亿t | 2010年 可能源化 利用秸秆 资源量/亿t | ||
|---|---|---|---|---|---|
| 秸秆 资源 总量 | 可收集 秸秆 资源量 | 可能源化利用秸秆资源量 | |||
| 全国 | 34.40 | 8.97 | 7.69 | 1.860 | 1.471 |
| 北京 | 23.13 | 0.01 | 0.01 | 0.001 | 0.002 |
| 天津 | 26.70 | 0.02 | 0.02 | 0.003 | 0.003 |
| 河北 | 22.70 | 0.46 | 0.40 | 0.054 | 0.049 |
| 山东 | 25.27 | 0.66 | 0.56 | 0.095 | 0.091 |
| 河南 | 37.07 | 0.84 | 0.69 | 0.203 | 0.193 |
| 辽宁 | 23.90 | 0.22 | 0.19 | 0.023 | 0.024 |
| 吉林 | 47.67 | 0.44 | 0.40 | 0.161 | 0.128 |
| 黑龙江 | 48.50 | 0.72 | 0.64 | 0.255 | 0.206 |
| 山西 | 17.00 | 0.17 | 0.15 | 0.006 | 0.005 |
| 陕西 | 18.67 | 0.16 | 0.13 | 0.010 | 0.010 |
| 甘肃 | 22.77 | 0.15 | 0.13 | 0.014 | 0.012 |
| 内蒙古 | 26.77 | 0.37 | 0.34 | 0.062 | 0.047 |
| 宁夏 | 20.30 | 0.05 | 0.04 | 0.006 | 0.005 |
| 新疆 | 33.57 | 0.31 | 0.27 | 0.071 | 0.056 |
| 西藏 | 17.10 | 0.01 | 0.01 | 0.000 | 0.000 |
| 青海 | 18.30 | 0.02 | 0.01 | 0.001 | 0.001 |
| 上海 | 46.23 | 0.01 | 0.01 | 0.003 | 0.004 |
| 江苏 | 45.07 | 0.42 | 0.32 | 0.113 | 0.107 |
| 浙江 | 50.17 | 0.08 | 0.07 | 0.026 | 0.026 |
| 安徽 | 43.73 | 0.45 | 0.36 | 0.122 | 0.110 |
| 湖北 | 40.83 | 0.35 | 0.28 | 0.086 | 0.079 |
| 湖南 | 27.83 | 0.34 | 0.27 | 0.040 | 0.038 |
| 江西 | 44.13 | 0.23 | 0.18 | 0.058 | 0.053 |
| 重庆 | 34.37 | 0.13 | 0.10 | 0.020 | 0.019 |
| 四川 | 21.10 | 0.42 | 0.34 | 0.013 | 0.012 |
| 贵州 | 29.57 | 0.14 | 0.12 | 0.017 | 0.016 |
| 云南 | 28.63 | 0.27 | 0.23 | 0.030 | 0.024 |
| 福建 | 24.87 | 0.07 | 0.05 | 0.008 | 0.008 |
| 广东 | 40.67 | 0.19 | 0.15 | 0.045 | 0.042 |
| 广西 | 44.83 | 0.36 | 0.30 | 0.105 | 0.094 |
| 海南 | 55.23 | 0.03 | 0.02 | 0.011 | 0.011 |
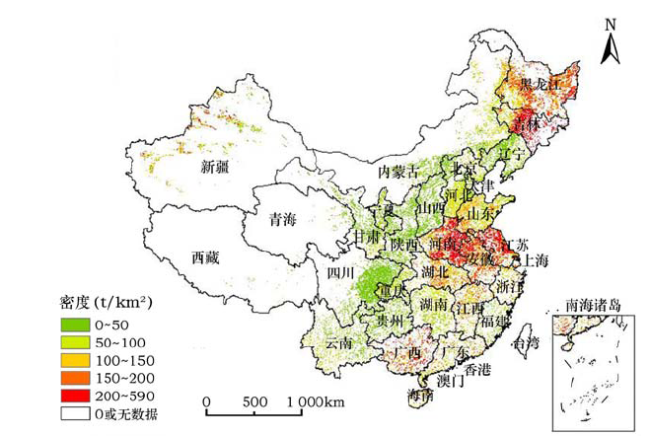
Figure 1 Density distribution of crop residue resource available for commercial energy production in 2014图1 2014年可能源化利用秸秆资源分布密度 注:香港、澳门和台湾地区无数据。 |
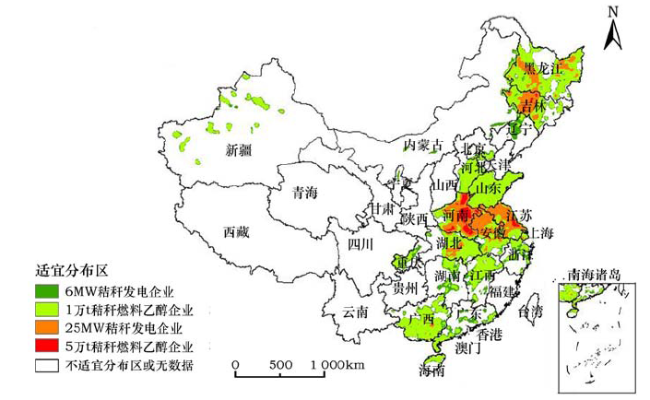
Figure 2 Suitability distributions of bioenergy plants with different scale in 2010图2 2010年不同规模秸秆能源企业分布 注:港、澳、台地区无数据。 |
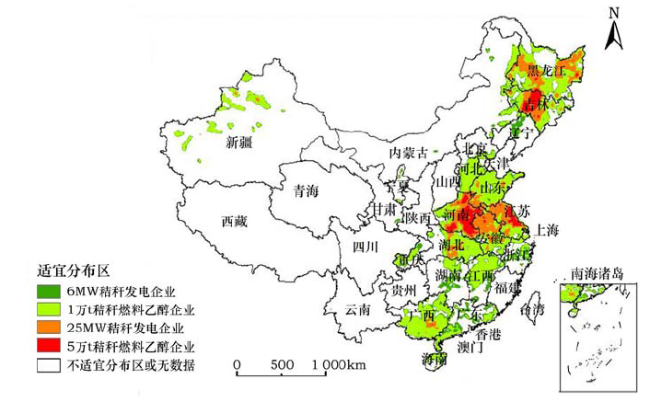
Figure 3 Suitability distributions of bioenergy plants with different scale in 2014图3 2014年不同规模秸秆能源企业分布 注:港、澳、台地区无数据。 |
Table 3 Change in distribution area of different types of bioenergy plants (km2)表3 各类型秸秆能源企业布分布面积变化 |
| 秸秆能源企业 | 面积 | |
|---|---|---|
| 2010年 | 2014年 | |
| 6MW秸秆发电企业 | 283 559 | 326 477 |
| 年产1万t燃料乙醇企业 | 1 097 572 | 1 118 936 |
| 25MW秸秆发电企业 | 350 108 | 385 919 |
| 年产5万t大型燃料乙醇企业 | 44 307 | 111 126 |
The authors have declared that no competing interests exist.
| [1] |
[
|
| [2] |
[
|
| [3] |
[
|
| [4] |
[
|
| [5] |
[
|
| [6] |
[
|
| [7] |
|
| [8] |
|
| [9] |
中华人民共和国国家统计局. 中国统计年鉴2015[M]. 北京:中国统计出版社,2015.
[National Bureau of Statistics of the People’s Republic of China. China Statistical Yearbook 2015[M]. Beijing:China Statistics Press,2015.]
|
| [10] |
|
| [11] |
[
|
| [12] |
[
|
| [13] |
|
| [14] |
|
| [15] |
|
| [16] |
|
| [17] |
|
| [18] |
|
| [19] |
[
|
| [20] |
|
| [21] |
|
| [22] |
[
|
| [23] |
[
|
| [24] |
[
|
| [25] |
[
|
| [26] |
[
|
| [27] |
[
|
/
| 〈 |
|
〉 |