
Impact of farmland economic contribution on farmland transfer market in Xiaogan, Wuhan, Chengdu and Suzhou
Received date: 2016-08-19
Request revised date: 2016-11-02
Online published: 2017-02-20
Copyright
Based on interviews with 1394 farmer households in Xiaogan, Wuhan, Chengdu and Suzhou, China, we primarily used canonical correlation analysis to measure the relationship between farmland economic contribution and the farmland transfer market. Significant factors were extracted using linear regression, which were then used in a Quantile Regression model to quantitatively analyze drivers of farmland economic contribution on the transfer market. Spatial heterogeneity and the economic incentives of the farmland transfer market were determined. The results show that the economic contributions of farmland are significantly different in Xiaogan, Wuhan, Chengdu and Suzhou, and their growth degrees in farmland transfer markets increase from Xiaogan to Suzhou. There are significant correlations between farmland economic contribution and the transfer market. Specifically, farmland production income has an inhibitory effect on farmland transfer, which decreases with rising income. In order to balance the supply and demand of farmland and ensure the effective development of farmland inflow and outflow markets, farmland rent should be determined through market pricing mechanisms. At the same time, to better exert the incentives of agricultural subsidies, the amount and target should be appropriately adjusted. For the immature farmland transfer market it is critical to enhance farmland production income. In the transformation areas of agricultural management mode, policy instruments are indispensable to intervene and encourage the transfer, and for the sake of interests of farmers, the degree of guiding transfer and forcing transfer should be better controlled. In developed areas, the function of farmland benefits to guarantee the sustainability of farmer household livelihoods is gradually degenerated. In these areas, farmer professional differentiation is a general trend and the farmland transfer market is highly developed.
ZHANG Minghui , CAI Yinying . Impact of farmland economic contribution on farmland transfer market in Xiaogan, Wuhan, Chengdu and Suzhou[J]. Resources Science, 2017 , 39(2) : 198 -208 . DOI: 10.18402/resci.2017.02.03
Table 1 The definition and description of variables表1 变量类型及含义 |
| 指标类别 | 变量 | 变量类型 | 含义 |
|---|---|---|---|
| 农地流转市场发育程度 | Y1农地流转率 | 连续变量 | 农地流转面积与承包地面积的比值 |
| Y2流转规范化水平 | 离散变量 | 流转规范化程度子指标提取主成分的综合得分 | |
| Y3政策满意度 | 离散变量 | 农户对基本农田保护政策和农业补贴政策的满意度 | |
| 农地经济贡献 | x1农业经营性收入/万元 | 连续变量 | 农户经营地作物亩产与单价的乘积 |
| x2农地流转租金/万元 | 连续变量 | 流转农地所获得的租金收入或支出 | |
| x3政策性农业补贴/万元 | 连续变量 | 直接支付给农户的农业补贴及生态补偿 | |
| x4非农收入/万元 | 连续变量 | 农户从事非农生产的收入 | |
| 农户特征变量 | x5韧性指数 | 离散变量 | 农户家庭抵御风险心理资产值 |
| x6户主年龄/岁 | 离散变量 | 农户家庭户主年龄 | |
| x7户主受教育程度/年 | 离散变量 | 农户家庭户主受教育年限 | |
| x8劳动力比重 | 连续变量 | 农户家庭劳动力与总人数之比 | |
| x9非农就业成员比重 | 连续变量 | 农户家庭非农就业成员与劳动力人数之比 |
Table 2 Descriptive statistics of variables表2 数据指标描述性统计 |
| 地区 | /万元 | /万元 | /万元 | /万元 | /岁 | /年 | |||||||
|---|---|---|---|---|---|---|---|---|---|---|---|---|---|
| 孝感 | 最大值 | 11.50 | 4.89 | 5.00 | 2.79 | 0.27 | 0.43 | 30.35 | 5.00 | 81 | 15.00 | 1.00 | 1.00 |
| 最小值 | 0.00 | 0.16 | 2.00 | 0.00 | 0.00 | 0.00 | 0.00 | 1.00 | 24 | 0.00 | 0.20 | 0.00 | |
| 平均值 | 0.44 | 2.77 | 3.19 | 0.45 | 0.06 | 0.06 | 4.11 | 3.40 | 57 | 5.45 | 0.81 | 0.33 | |
| 标准差 | 0.93 | 0.39 | 0.38 | 0.45 | 0.05 | 0.05 | 3.60 | 0.57 | 11 | 3.58 | 0.19 | 0.56 | |
| 武汉 | 最大值 | 14.00 | 5.11 | 4.00 | 6.24 | 0.50 | 0.29 | 23.19 | 5.00 | 83 | 15.00 | 1.00 | 1.00 |
| 最小值 | 0.00 | 1.13 | 1.00 | 0.00 | 0.03 | 0.00 | 0.00 | 1.00 | 24 | 0.00 | 0.40 | 0.00 | |
| 平均值 | 0.60 | 2.77 | 2.95 | 0.42 | 0.20 | 0.10 | 5.24 | 3.24 | 56 | 6.00 | 0.85 | 0.38 | |
| 标准差 | 1.38 | 0.64 | 0.51 | 0.75 | 0.10 | 0.05 | 3.83 | 0.62 | 11 | 2.98 | 0.18 | 0.66 | |
| 成都 | 最大值 | 10.00 | 5.74 | 5.00 | 0.71 | 0.20 | 0.54 | 32.40 | 5.00 | 86 | 19.00 | 1.00 | 1.00 |
| 最小值 | 0.00 | 0.00 | 2.00 | 0.00 | 0.00 | 0.00 | 0.00 | 2.00 | 22 | 0.00 | 0.17 | 0.00 | |
| 平均值 | 0.52 | 2.77 | 3.45 | 0.52 | 0.35 | 0.10 | 5.55 | 3.86 | 55 | 6.82 | 0.80 | 0.37 | |
| 标准差 | 0.89 | 0.64 | 0.48 | 0.86 | 0.34 | 0.09 | 3.53 | 0.76 | 12 | 3.35 | 0.22 | 0.70 | |
| 苏州 | 最大值 | 2.44 | 6.44 | 5.00 | 0.80 | 0.95 | 0.30 | 40.00 | 5.00 | 91 | 16.00 | 1.50 | 1.00 |
| 最小值 | 0.00 | 1.03 | 3.00 | 0.00 | 0.04 | 0.02 | 0.18 | 2.00 | 24 | 0.00 | 0.33 | 0.00 | |
| 平均值 | 0.93 | 2.77 | 3.42 | 0.03 | 0.27 | 0.11 | 6.07 | 3.53 | 58 | 7.24 | 0.76 | 0.20 | |
| 标准差 | 0.22 | 0.64 | 0.49 | 0.10 | 0.14 | 0.06 | 5.17 | 0.65 | 17 | 5.35 | 0.23 | 0.88 | |
注:①流转规范化水平和租金只统计参与流转农户;②以粮食交易的农地,按粮食市场交易价格核算成现金作为流转租金收入。 |
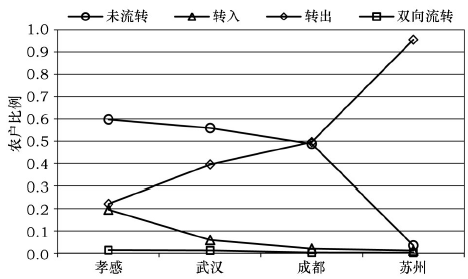
Table 3 Farmland transfer market overview of Xiaogan Wuhan Chengdu and Suzhou in 2015表3 2015年孝感、武汉、成都和苏州流转农地市场整体概况 |
| 地区 | 转入户占比 | 转出户占比 | 农地转入率 | 农地转出率 |
|---|---|---|---|---|
| 孝感 | 0.195 9 | 0.220 9 | 0.180 1 | 0.183 0 |
| 武汉 | 0.059 5 | 0.394 9 | 0.062 1 | 0.436 3 |
| 成都 | 0.020 5 | 0.495 4 | 0.032 5 | 0.433 0 |
| 苏州 | 0.012 1 | 0.955 9 | 0.023 8 | 0.881 3 |
注:数据为调研抽样所得,农地转入并不完全等于转出。 |
Figure 1 The line graph of farmland transfer overview of study areas in 2015图1 2015年研究区域农户农地流转概况对比 |
Table 4 The results of canonical correlation analysis between farmland economic contribution and transfer market in study areas表4 研究区农地经济贡献与农地流转市场典型相关分析结果 |
| 序号 | 典型相关系数 | 典型变量 | 卡方值 | Sig. |
|---|---|---|---|---|
| 1 | 0.457 | 206.240 | 0.000 | |
| 2 | 0.155 | 20.086 | 0.003 | |
| 3 | 0.031 | 0.744 | 0.689 |
Table 5 The regression results of farmland economic contribution to the activity of transfer market in study areas表5 研究区农地经济贡献对农地流转市场活跃度的回归结果 |
| 变量 | 转入 | 转出 | ||
|---|---|---|---|---|
| 估计系数 | 标准误差 | 估计系数 | 标准误差 | |
| x1农地经营性收入 | 0.001 3* | 0.000 7 | -0.003 4*** | 0.001 3 |
| x2土地租金 | 0.000 5 | 0.001 2 | 0.003 8* | 0.002 1 |
| x3政策性农业补贴 | -0.011 4*** | 0.003 9 | 0.016 0** | 0.006 9 |
| x4非农收入 | 0.000 2** | 0.000 1 | 0.000 1 | 0.000 1 |
| x5韧性指数 | -0.545 3 | 0.442 1 | -0.085 1 | 0.079 1 |
| x6户主年龄 | 0.010 8 | 0.034 2 | 0.077 8 | 0.061 1 |
| x7户主受教育程度 | 0.096 2 | 0.098 4 | 0.001 8 | 0.017 6 |
| x8劳动力比重 | -0.314 8* | 0.171 1 | 0.764 6** | 0.306 0 |
| x9非农就业成员比重 | -0.094 5 | 0.128 1 | 0.825 3*** | 0.229 2 |
| 常数项 | 0.431 2 | 0.332 4 | -1.023 7* | 0.594 6 |
注:***、**、*分别表示在1%、5%和10%的统计水平上显著。 |
Table 6 The results of quantile regression for farmland inflow market in study areas表6 研究区农地转入市场分位数回归结果 |
| 变量 | 分位数 | ||||
|---|---|---|---|---|---|
| 0.10 | 0.25 | 0.50 | 0.75 | 0.90 | |
| x1农地经营性收入 | -0.009 6*** (0.002 5) | -0.007 2* (0.004 2) | -0.006 8*** (0.001 6) | -0.004 0*** (0.002 3) | 0.002 7 (0.002 0) |
| x3政策性农业补贴 | -0.013 5 (0.013 1) | -0.029 5** (0.012 7) | -0.029 2*** (0.008 8) | -0.019 9* (0.018 7) | -0.000 4 (0.019 3) |
| x4非农收入 | 0.000 4 (0.000 4) | 0.000 0 (0.000 3) | -0.000 1 (0.000 2) | 0.000 3* (0.000 2) | 0.000 1 (0.002 1) |
| x8劳动力比重 | 0.588 7 (0.533 0) | 0.165 6 (0.530 8) | -0.090 3 (0.648 1) | -1.069 9 (0.557 2) | -0.325 4 (0.593 9) |
| 常数项 | -0.299 1 (0.517 5) | 0.349 4 (0.445 2) | 0.681 3* (0.455 8) | 1.399 1 (0.489 1) | 1.185 0*** (0.418 8) |
注:***、**、*分别表示在1%、5%和10%的统计水平上显著;括号内是标准误差。 |
Table 7 The results of quantile regression for farmland outflow market in study areas表7 研究区农地转出市场分位数回归结果 |
| 变量 | 分位数 | ||||
|---|---|---|---|---|---|
| 0.10 | 0.25 | 0.50 | 0.75 | 0.90 | |
| x1农地经营性收入 | -0.001 6 (0.003 7) | -0.006 4*** (0.002 3) | -0.005 7*** (0.002 2) | -0.004 1*** (0.001 2) | -0.002 7** (0.001 1) |
| x2土地租金 | 0.006 1* (0.004 5) | 0.003 6** (0.001 8) | 0.005 0* (0.003 3) | 0.004 8* (0.003 6) | 0.003 6 (0.004 5) |
| x3政策性农业补贴 | 0.003 6 (0.016 7) | 0.017 6* (0.010 8) | 0.025 3** (0.012 2) | 0.031 7** (0.012 1) | 0.022 9 (0.020 5) |
| x8劳动力比重 | 0.062 6 (0.806 0) | 0.846 2* (0.459 3) | 0.648 7 (0.496 6) | 0.624 4* (0.462 1) | 0.036 9 (0.501 9) |
| x9非农就业成员比重 | 0.104 6 (0.319 9) | 0.699 2*** (0.239 6) | 0.610 3** (0.291 8) | 0.469 3** (0.229 9) | 0.704 5*** (0.237 3) |
| 常数项 | -0.028 5 (0.801 1) | -0.830 6* (0.462 2) | -0.605 3* (0.430 3) | -0.483 5 (0.395 6) | 0.060 9 (0.488 6) |
注:***、**、*分别表示在1%、5%和10%的统计水平上显著;括号内是标准误差。 |
The authors have declared that no competing interests exist.
| [1] |
[
|
| [2] |
[
|
| [3] |
[
|
| [4] |
|
| [5] |
[
|
| [6] |
[
|
| [7] |
[
|
| [8] |
[
|
| [9] |
[
|
| [10] |
[
|
| [11] |
[
|
| [12] |
[
|
| [13] |
[
|
| [14] |
[
|
| [15] |
[
|
| [16] |
[
|
| [17] |
|
| [18] |
|
| [19] |
[
|
| [20] |
|
| [21] |
[
|
| [22] |
[
|
| [23] |
[
|
| [24] |
[
|
| [25] |
[
|
| [26] |
[
|
| [27] |
|
| [28] |
[
|
| [29] |
[
|
| [30] |
[
|
| [31] |
[
|
| [32] |
[
|
/
| 〈 |
|
〉 |