
Effect of sampling on spatial variability in soil salinity in the Yellow River Delta Area
Received date: 2016-06-23
Request revised date: 2016-09-22
Online published: 2016-12-20
Copyright
The monitoring of spatial variation in soil salinization forms the premise of the rational use of saline soil. The number of sampling points will affect the expression of spatial variation of soil salinity. Here,geostatistical methods were used to extract 12 soil sample subsets for Kenli County in the Yellow River Delta,China. The effect of different sampling numbers on the expression of soil salinity spatial variation was explored. The results showed that a great degree of variability in soil salinity. Effective ranges of most sample sets were between 13.47km and 16.77km. When the sampling number was less than 150 sample points,effective range was decreased (< 6.10km),small samples were better in indicating the variation characteristics at small scales (< 6.10km). With a reduction in sampling numbers,the capacity for describing details was weakened. Spatial variation structure was not expressed well,especially when the number was small(<150). With increasing sampling numbers,the root mean square error (RMSE)was reduced,indicating that the accuracy of the kriging interpolation method was reduced. With increasing sampling numbers,the mean error(ME)had no obvious reduced trend. In summary,the samples number to meet the spatial variability of soil salinity should not be less than 150. We conclude that,in evaluating kriging prediction accuracy the single evaluation index may not be able to completely evaluate predicted results. Combined with the actual fact,a variety of comprehensive indexes may be needed to evaluate predicted results. These findings are applicable to other areas with similar environmental conditions to Kenli County.
ZHANG Xiaoguang , WANG Zhigang , SONG Xiangyun , LIU Peiru , LI Shimei , YANG Xia . Effect of sampling on spatial variability in soil salinity in the Yellow River Delta Area[J]. Resources Science, 2016 , 38(12) : 2375 -2382 . DOI: 10.18402/resci.2016.12.16
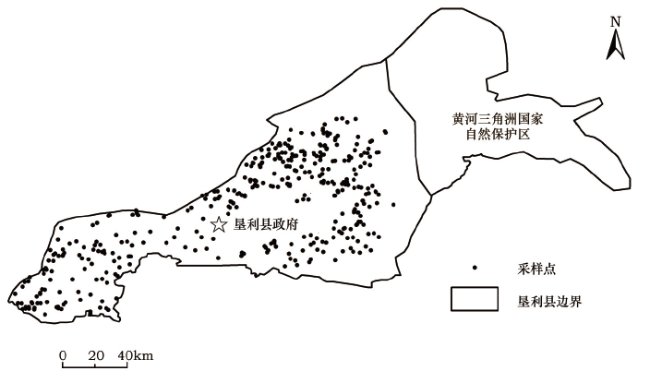
Figure 1 Diagrammatic map of sampling site and study area图1 研究区范围和采样点 |
Table 1 Descriptive statistical characteristics of soil salinity in different sample set表1 不同样本集土壤盐分描述性统计特征 |
| 样点个数 | 最小值 /(g/kg) | 最大值 /(g/kg) | 平均值 /(g/kg) | 标准差 /(g/kg) | 偏度系数 | 峰度系数 | 中值 /(g/kg) | 变异系数 /% |
|---|---|---|---|---|---|---|---|---|
| 926 | 0.20 | 8.60 | 1.43 | 1.15 | 2.45 | 11.00 | 1.10 | 80.85 |
| 801 | 0.20 | 8.60 | 1.41 | 1.12 | 2.36 | 10.43 | 1.10 | 79.43 |
| 704 | 0.20 | 8.60 | 1.41 | 1.11 | 2.40 | 10.97 | 1.10 | 78.72 |
| 598 | 0.20 | 8.60 | 1.41 | 1.09 | 2.30 | 10.18 | 1.10 | 77.31 |
| 502 | 0.20 | 8.60 | 1.42 | 1.12 | 2.36 | 10.25 | 1.10 | 78.87 |
| 401 | 0.20 | 8.60 | 1.41 | 1.10 | 2.43 | 11.10 | 1.10 | 78.01 |
| 300 | 0.20 | 8.60 | 1.42 | 1.11 | 2.51 | 12.10 | 1.10 | 78.17 |
| 201 | 0.20 | 8.60 | 1.45 | 1.09 | 2.48 | 12.64 | 1.10 | 75.17 |
| 150 | 0.20 | 8.60 | 1.49 | 1.15 | 2.50 | 12.57 | 1.10 | 77.18 |
| 100 | 0.30 | 4.40 | 1.31 | 0.87 | 1.64 | 5.52 | 1.05 | 66.41 |
| 75 | 0.30 | 8.60 | 1.61 | 1.30 | 2.64 | 12.77 | 1.20 | 80.75 |
| 50 | 0.30 | 4.40 | 1.19 | 0.86 | 1.99 | 6.92 | 1.00 | 72.27 |
Table 2 Parameters of semivariance of soil salinity in different sample set表2 不同采样点数量下的土壤盐分半方差函数参数 |
| 样点数 | 模型 | 块金值C0 | 基台值Sill | 块基比 (C0 /Sill)/% | 有效变程 /km | 决定系数 | 残差 |
|---|---|---|---|---|---|---|---|
| 926 | 指数模型 | 0.42 | 1.01 | 42.60 | 14.76 | 0.66 | 0.10 |
| 801 | 指数模型 | 0.44 | 0.98 | 44.30 | 14.04 | 0.60 | 0.11 |
| 704 | 指数模型 | 0.44 | 0.99 | 44.70 | 14.04 | 0.63 | 0.09 |
| 598 | 指数模型 | 0.45 | 0.97 | 46.10 | 13.65 | 0.61 | 0.08 |
| 502 | 指数模型 | 0.47 | 1.00 | 47.20 | 15.66 | 0.66 | 0.08 |
| 401 | 指数模型 | 0.47 | 0.94 | 49.90 | 13.47 | 0.60 | 0.07 |
| 300 | 指数模型 | 0.41 | 0.89 | 45.80 | 16.77 | 0.66 | 0.08 |
| 201 | 指数模型 | 0.39 | 0.82 | 47.30 | 14.04 | 0.58 | 0.07 |
| 150 | 球状模型 | 0.38 | 0.82 | 45.90 | 6.10 | 0.36 | 0.01 |
| 100 | 指数模型 | 0.25 | 0.69 | 35.80 | 5.94 | 0.31 | 0.05 |
| 75 | 指数模型 | 0.16 | 0.63 | 25.50 | 3.72 | 0.32 | 0.10 |
| 50 | 指数模型 | 0.75 | 0.79 | 95.10 | 2.00 | 0.01 | 0.22 |
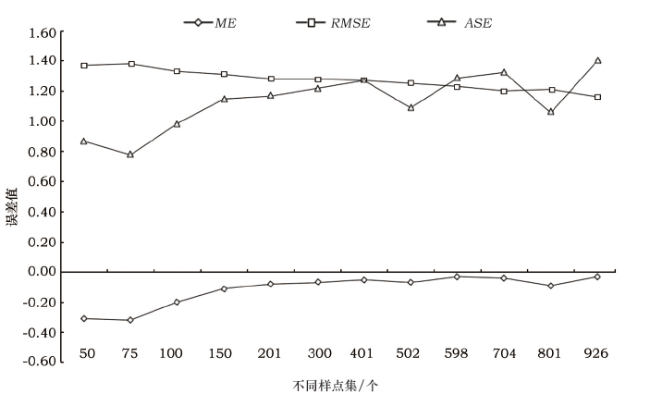
Figure 2 Prediction errors of soil salinity in different sample set图2 不同样点集土壤盐分预测误差 |
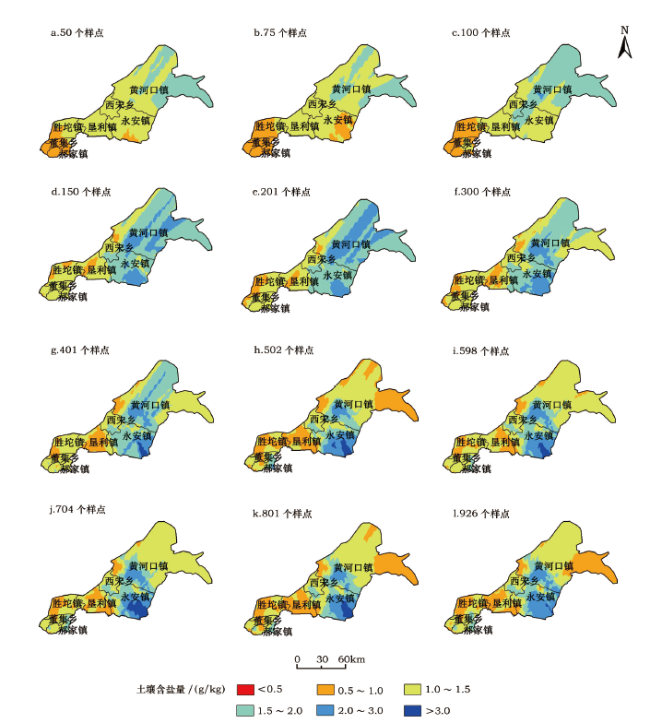
Figure 3 Expression of spatial variation of soil salinity in different sample set图3 不同样点集土壤盐分空间变异表达 |
The authors have declared that no competing interests exist.
| [1] |
[
|
| [2] |
|
| [3] |
|
| [4] |
[
|
| [5] |
[
|
| [6] |
[
|
| [7] |
|
| [8] |
[
|
| [9] |
[
|
| [10] |
[
|
| [11] |
[
|
| [12] |
[
|
| [13] |
[
|
| [14] |
[
|
| [15] |
|
| [16] |
[
|
| [17] |
|
| [18] |
|
/
| 〈 |
|
〉 |