
Geography distribution of China’s energy industry and evolution of energy industrial bases
Received date: 2016-06-02
Request revised date: 2016-11-05
Online published: 2016-12-20
Copyright
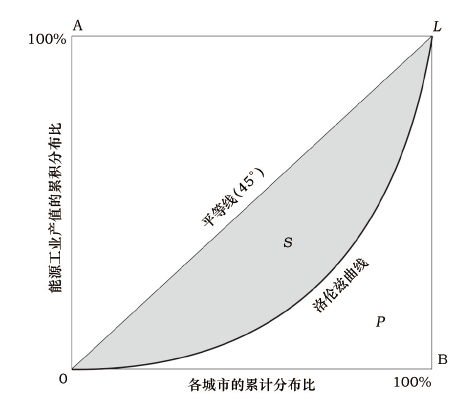
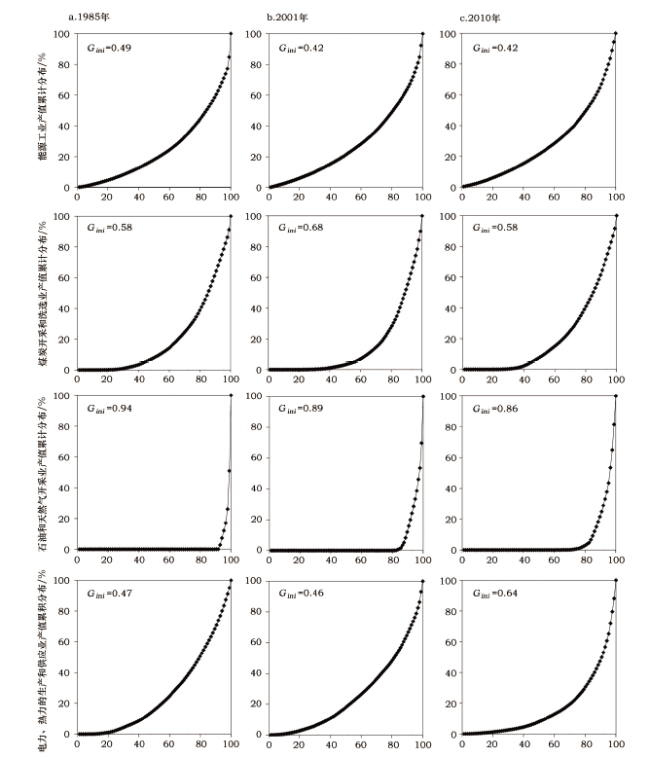
The energy industry plays an important role in China’s economic development. This paper analyses the process of energy industry distribution and focuses on a key period of energy industry development. Centralization and diffusion patterns of energy industry from 1985 to 2010 are analyzed based on the Gini coefficient,Lorenz curve and spatial autocorrelation analysis. We then built a system identification framework to identify energy industrial bases and draw a distribution map. Spatial characteristics and evolution of energy industrial bases are discussed. We found that the space distribution of energy industry as a whole is relatively balanced,but the centralization and diffusion patterns of categories (coal,oil and electricity)are significant different. The spatial distribution of the coal mining and dressing industry presents for first dispersion and then relative concentration and re-dispersion. Petroleum and natural gas mining shows a dispersion trend,but the overall degree of agglomeration is high. The spatial distribution of the production and supply of electric power and hot power is relatively more balanced,and shows a clear trend of agglomeration. The total number of energy industrial bases was stable in the study period. Most of the bases are concentrated in central China. The number of bases in western China shows an upwards trend. Persistent-energy-industrial-bases total 33 and occupy an important position in China’s energy industry. New and emerging energy industrial bases are mainly distributed in energy-rich regions such as Inner Mongolia,Xinjiang,Shaanxi and Shanxi. Integration of energy industrial bases is obvious. The scale of comprehensive industrial bases increased,while the scale of single energy industrial bases comprises small characteristics. With relevant industrial development,single energy industrial bases are transforming to comprehensive industrial bases.
Key words: energy industry; industrial bases; spatial distribution; evolution; China
CHEN Linlin , YANG Yu , HONG Hui , JIN Fengjun . Geography distribution of China’s energy industry and evolution of energy industrial bases[J]. Resources Science, 2016 , 38(12) : 2256 -5569 . DOI: 10.18402/resci.2016.12.06
Figure 1 Gini coefficient and Lorenz curve图1 基尼系数与洛伦兹曲线 |
Table 1 Distribution of location quotient of two digital industries in 2010表1 2010年两位数产业区位熵大于1的城市分布数量统计 |
| 行业大类 | ≥1 | >1且≤2 | >2且≤5 | >5 |
|---|---|---|---|---|
| 石油和天然气开采业 | 32 | 6 | 9 | 17 |
| 煤炭开采和洗选业 | 122 | 28 | 47 | 47 |
| 电力、热力的生产和供应业 | 191 | 79 | 78 | 34 |
Table 2 Classification of energy industrial base in 1985, 2001 and 2010 (亿元,%)表2 1985年、2001年、2010年能源基地类型划分的标准 |
| 大型基地 | 中型基地 | 小型基地 | ||||||
|---|---|---|---|---|---|---|---|---|
| 产值规模 | 占工业总产值比重 | 产值规模 | 占工业总产值比重 | 产值规模 | 占工业总产值比重 | |||
| 1985年 | >600 | >1 | 170~600 | 0.3~1.0 | <170 | <0.3 | ||
| 2001年 | >2 300 | >1 | 650~2 300 | 0.3~1.0 | <650 | <0.3 | ||
| 2010年 | >7 000 | >1 | 2 000~7 000 | 0.3~1.0 | <2 000 | <0.3 | ||
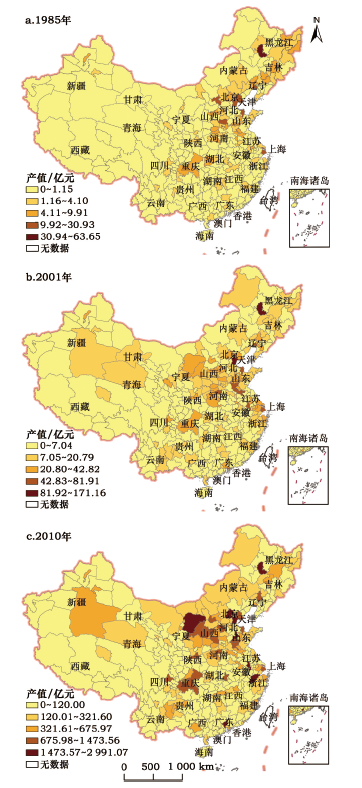
Figure 2 Energy industrial output value of China in 1985,2001 and 2010 |
Figure 3 The gini coefficient of China's energy industry and its sub-sectors from 1985 to 2010图3 1985-2010中国能源工业行业及其内部细分行业的基尼系数 |
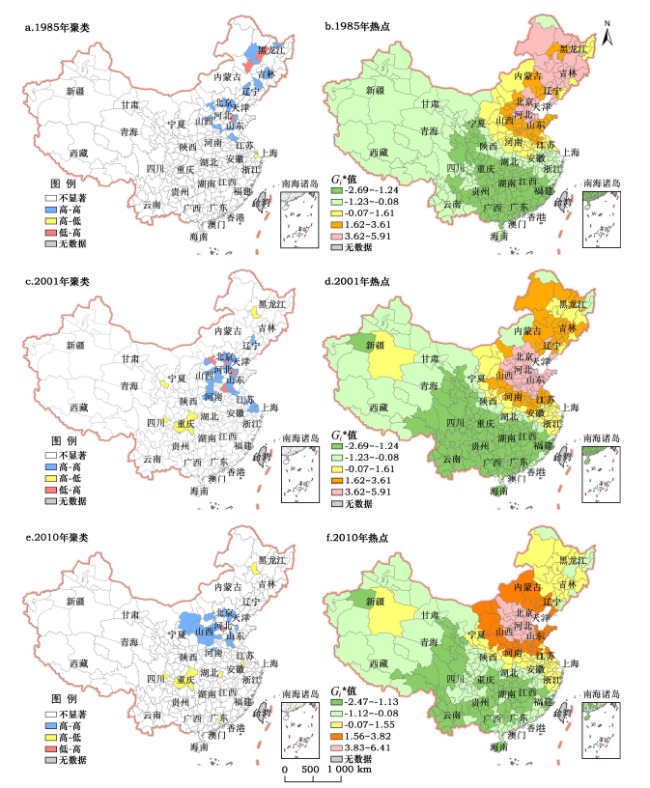
Figure 4 Spatial clustering and hot & cold spots of energy industrial in 1985,2001 and 2010 |
Table 3 Regional distribution of energy industrial bases of China in 1985, 2001 and 2010 (%)表3 1985年、2001年和2010年中国能源工业基地的区域分布变化 |
| 东部地区 | 中部地区 | 西部地区 | 东北地区 | 工业基地总数 | |||||
|---|---|---|---|---|---|---|---|---|---|
| 数量 | 比重 | 数量 | 比重 | 数量 | 比重 | 数量 | 比重 | ||
| 1985年 | 20 | 23.81 | 34 | 40.48 | 12 | 14.29 | 18 | 21.43 | 84 |
| 2001年 | 21 | 21.65 | 36 | 37.11 | 24 | 24.74 | 16 | 16.49 | 97 |
| 2010年 | 19 | 22.09 | 35 | 40.70 | 21 | 24.42 | 11 | 12.79 | 86 |
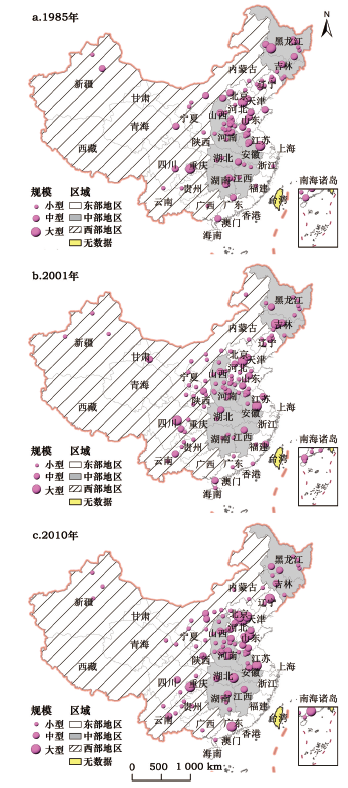
Figure 5 Distribution of China’s energy industrial bases in 1985,2001 and 2010 |
Table 4 Classification of China’s energy industrial bases表4 中国能源工业基地的主要类型 |
| 类型 | 规模 | 基地类型及基地分布 | |
|---|---|---|---|
| 1985年 | 综合型 | 中型 | 三行业主导(原材料、能源、轻工):邯郸、韶关、唐山、泰安 |
| 中型 | 四行业主导(能源、原材料、装备、轻工):锦州、太原、徐州、牡丹江 | ||
| 小型 | 两行业主导(原材料和能源):克拉玛依 | ||
| 专业型 | 大型 | 大庆 | |
| 中型 | 东营、本溪、大同 | ||
| 小型 | 枣庄、平顶山、朝阳、宜昌、阜新、通化、长治、阳泉、焦作、淮北、濮阳、鸡西、晋城、邢台、赤峰、承德、鹤岗、石咀山、丹江口、萍乡、铜川、玉门、三门峡、鹤壁、冷水江(丽江)、七台河、乌海、椒江(台州)、韩城(渭南)、青铜峡(吴忠)、资兴(郴州)、满洲里 | ||
| 2001年 | 综合型 | 中型 | 两行业主导(原材料和能源):大庆 |
| 中型 | 三行业主导(原材料、能源、轻工):济宁 | ||
| 小型 | 单行业主导(能源):酒泉 | ||
| 小型 | 两行业主导(原材料、能源):盘锦、平顶山、吴忠、延安、三门峡 | ||
| 小型 | 两行业主导(能源和轻工):商丘 | ||
| 小型 | 三行业主导(原材料、能源、轻工):东营、鄂尔多斯、渭南、赤峰、巴音郭楞 | ||
| 专业型 | 小型 | 咸阳、濮阳、潜江、鹤壁、淮南、阳泉、铁岭、吕梁、淮北、六盘水、晋城、朔州、怀化、石嘴山、阜新、鸡西、榆林、萍乡、乌海、铜川、乌兰察布、呼伦贝尔、西南布依族苗族自治州、双鸭山、鹤岗、平凉、七台河 | |
| 2010年 | 综合型 | 中型 | 单行业主导(能源):鄂尔多斯 |
| 中型 | 双行业主导(能源、原材料):大庆、保定、太原 | ||
| 中型 | 四行业主导(能源、原材料、装备、轻工):石家庄、哈尔滨、南昌、济南、枣庄、济宁、泰安、郑州、许昌、长沙、成都、东营、福州 | ||
| 小型 | 双行业主导(原材料、能源):娄底、乌鲁木齐、张家口、平顶山、吕梁、长治、晋中、银川、锡林郭勒盟 | ||
| 小型 | 三行业主导(原材料、能源、轻工):盘锦、衡阳、通辽、白山、咸阳、贵阳、揭阳、濮阳、呼和浩特、鹤壁、宜宾、松原 | ||
| 专业型 | 小型 | 大同、阳泉、晋城、朔州、乌海、乌兰察布、鸡西、鹤岗、双鸭山、七台河、淮南、淮北、达州、六盘水、毕节、榆林、庆阳、巴音郭楞蒙古自治州 |
The authors have declared that no competing interests exist.
| [1] |
[
|
| [2] |
[
|
| [3] |
[
|
| [4] |
[
|
| [5] |
[
|
| [6] |
[
|
| [7] |
[
|
| [8] |
[
|
| [9] |
[
|
| [10] |
[
|
| [11] |
[
|
| [12] |
[
|
| [13] |
[
|
| [14] |
[
|
| [15] |
[
|
| [16] |
[
|
| [17] |
[
|
| [18] |
[
|
| [19] |
[
|
| [20] |
[
|
| [21] |
[
|
| [22] |
[
|
| [23] |
|
| [24] |
|
| [25] |
[
|
| [26] |
[
|
/
| 〈 |
|
〉 |