
Measurement and scale effect of grain-production dominated zone cultivated land protection externalities under multi-level boundaries
Received date: 2016-03-29
Request revised date: 2016-06-01
Online published: 2016-08-25
Copyright
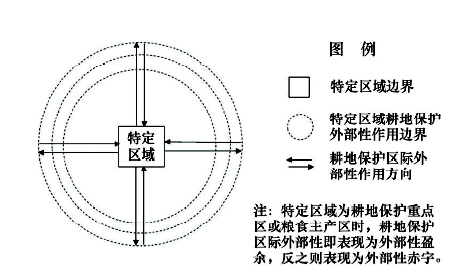
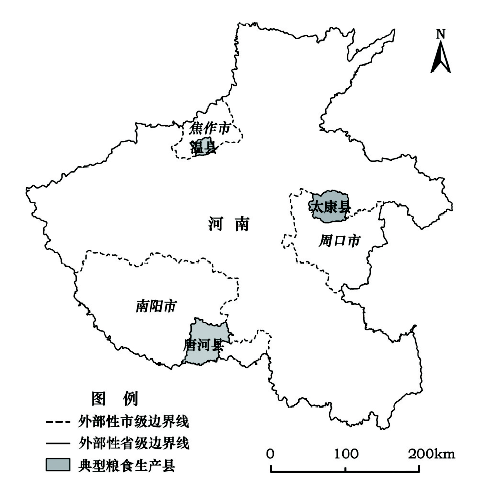
The scientific measurement of cultivated land protection externalities in grain-production-dominated zones is an important basis of the regional and interregional economic compensation standard of cultivated land protection. At the same time it is also a key link for the construction of economic compensation mechanisms of cultivated land protection. The cultivated land protection externalities boundary of grain-production dominated zone is related to the scale of the research field,which affects the measurement and segmentation of externalities. Therefore,in this study,a concept model of multi-level boundary with respect to cultivated land protection externalities in grain-production-dominated zones is proposed. Based on this,the measurement method and model of cultivated land protection externalities and its external multi-level boundary are constructed. Three typical grain-production dominated counties:Taikang County (Zhoukou)in Huanghuaihai Plain,Tanghe County (Nanyang)in Nanyang Basin and Wen County (Jiaozuo)in the north and western piedmont plain of Henan province were selected as study sites. Externalities and scale effects of each these counties were measured and analyzed under prefectural and provincial boundaries. We found that the externalities of cultivated land protection in grain-production dominated zone have multi-level boundary characteristics. The boundary can be a natural boundary line (watershed boundaries,etc.)and also can be a social-economic boundary line (administrative boundaries)as well. There are significant temporal-spatial differences of the externalities between theoretical value and realistic value under the actions of boundary scales variations. These differences will affect the criteria of economic compensation per unit for cultivated land protection and the strength of inter-regionally fiscal transfer payments. A dynamic multi-level compensation system needs to be established based on the regulation of superior government and fiscal transfer payments in light of temporal-spatial variations in externalities.
NIU Haipeng , XIAO Dongyang , GAO Zhifang . Measurement and scale effect of grain-production dominated zone cultivated land protection externalities under multi-level boundaries[J]. Resources Science, 2016 , 38(8) : 1491 -1502 . DOI: 10.18402/resci.2016.08.08
Figure 1 Concept model of typical zone cultivated land protection externalities multi-level boundary图1 特定区域耕地保护外部性多层次作用边界概念模型 |
Figure 2 Location and externalities boundary of grain-production dominated zone图2 粮食主产区典型区域位置和外部性作用边界 |
Table 1 Theoretical value of ecological and social benefits of cultivated land per unit(Taikang, Tanghe and Wen County) under provincial boundary in 2000, 2004, 2008, 2012(元/hm2,%)表1 省级边界下太康县、唐河县和温县单位面积耕地生态社会效益理论值 |
| 本研究耕地 效益体系 | 2000年 | 2004年 | 2008年 | 2012年 | |||||
|---|---|---|---|---|---|---|---|---|---|
| 效益值 | 比例 | 效益值 | 比例 | 效益值 | 比例 | 效益值 | 比例 | ||
| 生态效益 | 涵养水源 | 527.5 | 6.55 | 771.0 | 6.99 | 1 025.0 | 6.81 | 1 359.3 | 6.35 |
| 保持水土 | 1 007.1 | 12.50 | 1 471.9 | 13.34 | 1 956.8 | 13.00 | 2 594.9 | 12.13 | |
| 改善小气候 | 664.5 | 8.25 | 971.3 | 8.81 | 1 291.2 | 8.58 | 1 712.3 | 8.00 | |
| 改善大气质量 | 493.3 | 6.12 | 720.9 | 6.54 | 958.4 | 6.37 | 1 271.0 | 5.94 | |
| 生物多样性 | 698.8 | 8.67 | 1 021.3 | 9.26 | 1 357.8 | 9.02 | 1 800.6 | 8.41 | |
| 土壤净化 | 952.3 | 11.82 | 1 391.8 | 12.62 | 1 850.3 | 12.29 | 2 453.7 | 11.47 | |
| 小计 | 4 343.4 | 53.89 | 6 348.2 | 57.55 | 8 439.5 | 56.06 | 11 191.8 | 52.30 | |
| 社会效益 | 耕地粮食安全 | 1 436.2 | 17.82 | 2 601.9 | 23.59 | 3 578.0 | 23.77 | 5 356.6 | 25.03 |
| 耕地社会保障 | 2 163.5 | 26.84 | 1 909.9 | 17.32 | 2 810.3 | 18.67 | 4 550.6 | 21.27 | |
| 景观与科学文化 | 116.5 | 1.45 | 170.2 | 1.54 | 226.3 | 1.50 | 300.1 | 1.40 | |
| 小计 | 3 716.1 | 46.11 | 4 682.0 | 42.45 | 6 614.6 | 43.94 | 10 207.3 | 47.70 | |
| 合计 | 8 059.5 | 100.00 | 11 030.2 | 100.00 | 15 054.1 | 100.00 | 21 399.1 | 100.00 | |
Table 2 Ecological and social benefits of cultivated land per unit(Taikang, Tanghe and Wen County) under provincial and prefectural boundary in 2012(元/hm2)表2 2012年省市级边界下太康县、唐河县和温县单位面积耕地生态社会效益 |
| 耕地效益体系 | 市级边界下 | 省级边界下 | |||
|---|---|---|---|---|---|
| 太康县 | 唐河县 | 温县 | 太康县、唐河县、温县 | ||
| 生态效益 | 涵养水源 | 1 550.1 | 1 248.6 | 1 708.8 | 1 359.3 |
| 保持水土 | 2 959.3 | 2 383.7 | 3 262.2 | 2 594.9 | |
| 改善小气候 | 1 952.7 | 1 572.9 | 2 152.6 | 1 712.3 | |
| 改善大气质量 | 1 449.5 | 1 167.5 | 1 597.8 | 1 271.0 | |
| 生物多样性 | 2 053.4 | 1 654.0 | 2 263.6 | 1 800.6 | |
| 土壤净化 | 2 798.3 | 2 253.9 | 3 084.7 | 2 453.7 | |
| 小计 | 12 763.2 | 10 280.6 | 14 069.8 | 11 191.8 | |
| 社会效益 | 耕地粮食安全 | 4 920.7 | 4 929.1 | 7 009.4 | 5 356.6 |
| 耕地社会保障 | 4 177.4 | 3 630.0 | 4 590.2 | 4 550.6 | |
| 景观与科学文化 | 342.2 | 275.7 | 377.3 | 300.1 | |
| 小计 | 9 440.4 | 8 834.8 | 11 976.9 | 10 207.3 | |
| 合计 | 22 203.7 | 19 115.4 | 26 046.7 | 21 399.1 | |
Table 3 Surplus and deficit of inter-regional externalities of cultivated land protection(Taikang,Tanghe and Wen county)under provincial boundary in 2012表3 2012年省级边界下太康县、唐河县、温县耕地保护区际外部性盈余/赤字(区际补偿标准) |
| 单元 | 耕地保护经济 补偿供给/亿元 | 人口数量 /万人 | 省级边界耕地保护经济补偿需求/亿元 | 省级边界经济补偿盈余/赤字/亿元 |
|---|---|---|---|---|
| 太康县 | 14.31 | 148.01 | 12.04 | 2.26 |
| 河南省(不含太康县) | 843.59 | 10 393.99 | 845.86 | -2.26 |
| 唐河县 | 16.69 | 142.73 | 11.62 | 5.07 |
| 河南省(不含唐河县) | 841.21 | 10 399.27 | 846.29 | -5.07 |
| 温县 | 4.03 | 44.68 | 3.64 | 0.40 |
| 河南省(不含温县) | 853.87 | 10 497.32 | 854.27 | -0.40 |
Table 4 Realistic values of externalities of cultivated land protection(Taikang,Tanghe and Wen county)under provincial and prefectural boundary in 2012(元/hm2)表4 2012年省级和市级边界下太康县、唐河县和温县不同级别耕地保护外部性现实值(补偿标准) |
| 边界 | 区域 | 外部性 | 4等 | 5等 | 6等 | 7等 | 8等 | 9等 | 10等 | 11等 | 12等 | 总体 |
|---|---|---|---|---|---|---|---|---|---|---|---|---|
| 市级 边界 | 太康县 | 理论值 | 31 762.6 | 29 000.7 | 26 238.7 | 23 476.7 | 20 714.8 | 17 952.8 | 15 190.8 | 12 428.9 | 9 666.9 | 22 203.7 |
| 现实值 | 14 560.0 | 13 293.9 | 12 027.8 | 10 761.7 | 9 495.7 | 8 229.6 | 6 963.5 | 5 697.4 | 4 431.3 | 10 178.2 | ||
| 唐河县 | 理论值 | 27 344.8 | 24 967.0 | 22 589.2 | 20 211.4 | 17 833.6 | 15 455.8 | 13 077.9 | 10 700.1 | 8 322.3 | 19 115.4 | |
| 现实值 | 11 993.4 | 10 950.5 | 9 907.6 | 8 864.7 | 7 821.8 | 6 778.9 | 5 736.0 | 4 693.1 | 3 650.2 | 8 384.0 | ||
| 温县 | 理论值 | 37 260.1 | 34 020.1 | 30 780.1 | 27 540.1 | 24 300.1 | 21 060.1 | 17 820.0 | 14 580.0 | 11 340.0 | 26 046.7 | |
| 现实值 | 22 546.1 | 20 585.6 | 18 625.0 | 16 664.5 | 14 704.0 | 12 743.4 | 10 782.9 | 8 822.4 | 6 861.9 | 15 760.9 | ||
| 省级 边界 | 太康县 唐河县 温县 | 理论值 | 30 611.7 | 27 949.8 | 25 287.9 | 22 626.0 | 19 964.1 | 17 302.2 | 14 640.4 | 11 978.5 | 9 316.6 | 21 399.1 |
| 现实值 | 15 045.6 | 13 737.3 | 12 429.0 | 11 120.7 | 9 812.4 | 8 504.1 | 7 195.7 | 5 887.4 | 4 579.1 | 10 517.7 |
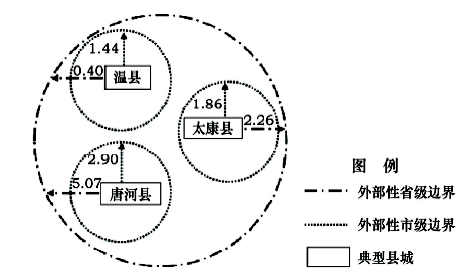
Figure 3 Realistic surplus and deficit of inter- regional externalities of cultivated land protection(Taikang,Tanghe and Wen county)under provincial and prefectural boundary in 2012图3 2012年省、市级边界下太康县、唐河县、温县区际外部性现实值盈余/赤字示意 注:图中数据表示特定区域在省、市级边界下的区际外部性现实值的盈余/赤字,其中正值表示盈余,负值表示赤字。 |
Table 5 Surplus and deficit of inter-regional externalities of cultivated land protection (Taikang,Tanghe and Wen county)under prefectural boundary in 2012表5 2012年市级边界下太康县、唐河县、温县耕地保护区际外部性盈余/赤字(区际补偿标准) |
| 单元 | 耕地保护经济补偿供给/亿元 | 人口数量 /万人 | 市级边界耕地保护经济补偿需求/亿元 | 市级边界经济补偿盈余/赤字/亿元 |
|---|---|---|---|---|
| 太康县 | 13.85 | 148.01 | 11.99 | 1.86 |
| 周口市(不含太康县) | 77.37 | 977.99 | 79.22 | -1.86 |
| 唐河县 | 13.30 | 142.73 | 10.41 | 2.90 |
| 南阳市(不含唐河县) | 71.70 | 1 023.27 | 74.60 | -2.90 |
| 温县 | 6.04 | 44.68 | 4.60 | 1.44 |
| 焦作市(不含温县) | 31.64 | 321.32 | 33.08 | -1.44 |
The authors have declared that no competing interests exist.
| [1] |
[
|
| [2] |
|
| [3] |
|
| [4] |
|
| [5] |
|
| [6] |
|
| [7] |
|
| [8] |
|
| [9] |
|
| [10] |
[
|
| [11] |
[
|
| [12] |
[
|
| [13] |
[
|
| [14] |
[
|
| [15] |
[
|
| [16] |
[
|
| [17] |
[
|
| [18] |
[
|
| [19] |
[
|
| [20] |
[
|
| [21] |
[
|
| [22] |
[
|
| [23] |
[
|
| [24] |
[
|
| [25] |
河南省统计局,国家统计局河南调查总队. 河南统计年鉴[M]. 北京:中国统计出版社,2001,2005,2009,2013.
[Bureau of Statistics of Henan Province,Henan Survey Corps of National Bureau of statistics. Henan Statistical Yearbook[M]. Beijing:China Statistics Press,2001,2005,2009,2013.]
|
| [26] |
国家发展和改革委员会价格司. 全国农产品成本收益资料汇编[M]. 北京:中国统计出版社,2001,2005,2009,2013.
[The Price Department of National Development and Reform Com-mission. Data Compilation of National Agricultural Product Cost and Income[M]. Beijing:China Statistics Press,2001,2005,2009,2013.]
|
/
| 〈 |
|
〉 |