
The estimation of aboveground vegetation carbon storage based on GF-1 WFV satellite images in Fengning County
Received date: 2016-02-22
Request revised date: 2016-04-28
Online published: 2016-06-18
Copyright
Quantitative estimation of carbon storage of terrestrial vegetation and its distribution can help to understand the regional carbon balance,and provide scientific basis for the management of emission reduction and sustainable development. According to GF-1 WFV satellite remote sensing images and synchronous field surveys conducted in 2015 in Fengning county,Hebei,China we established single curve regression models and multiple linear regression models of aboveground biomass for forest,shrub and grassland. Optical inversion models were selected to calculate vegetation aboveground biomass,and aboveground carbon density and carbon storage were estimated. Spatial distribution features of the study area were analyzed using GIS. We found that our multiple regression models had good inversion precision,which can be well applied to estimate vegetation aboveground biomass for the forest and grassland (R2 values respectively 0.528 and 0.777). The exponential equation based on RVI was the best inversion model to estimate shrub aboveground biomass and the R2 value was 0.620. As at August 2015,the aboveground vegetation carbon densities were respectively 55.406tC/hm2,3.304tC/hm2 and 0.533 t C/hm2 for forest,shrub and grassland. Aboveground vegetation carbon storages were respectively 15.714TgC,1.016TgC and 0.080TgC for forest,shrub and grassland. The total aboveground vegetation carbon storage was 16.810TgC except for croplands,indicating that forest vegetation represents the main aboveground carbon pool. The vegetation carbon density in Fengning county increased, then decreased with rising of elevation. The vegetation aboveground carbon storage lies mainly at an altitude of 700~1500m.
KONG Fanjie , LI Xiaobing , BAI Yunxiao , LI Xiang , WANG Hong . The estimation of aboveground vegetation carbon storage based on GF-1 WFV satellite images in Fengning County[J]. Resources Science, 2016 , 38(6) : 1054 -1064 . DOI: 10.18402/resci.2016.06.05
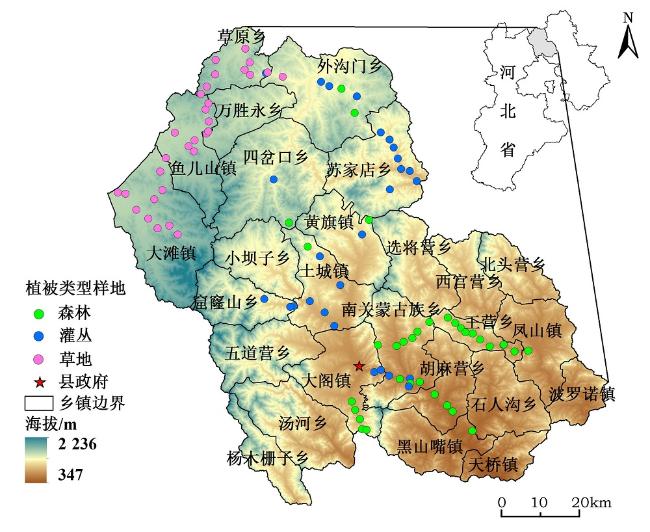
Figure 1 Location of Fengning County and distribution of survey samples in 2015图1 丰宁县地理位置及2015年调查样地点分布 |
Table 1 Parameters of GF-1 WFV multispectral satellite image表1 GF-1 WFV多光谱卫星影像参数 |
| 参数 | 多光谱相机 |
|---|---|
| 波长范围/μm | 0.45~0.52 |
| 0.52~0.59 | |
| 0.63~0.69 | |
| 0.77~0.89 | |
| 空间分辨率/m | 16 |
| 幅宽/km | 800(4台相机组合) |
| 重访周期/d | 4 |
Table 2 Vegetation index calculation method used in this study表2 研究中用到的植被指数计算方法 |
| 植被指数 | 计算公式 | 参考文献 |
|---|---|---|
| 归一化差值植被指数NDVI | [21] | |
| 差值植被指数DVI | [22] | |
| 比值植被指数RVI | [23] | |
| 增强型植被指数EVI | [24] | |
| 土壤调整植被指数SAVI | [25] | |
| 修正土壤调整植被指数MSAVI | [26] | |
| 优化土壤调整指数OSAVI | [27] | |
| 修正三角植被指数2 MTVI2 | [28] | |
| 归一化绿波波段差值植被指数GNDVI | [29] | |
| 考虑绿光改进的植被指数GBNDVI | [30] |
注:、、、分别代表GF-1 WFV数据在蓝、绿、红、近红外波段的反射率。 |
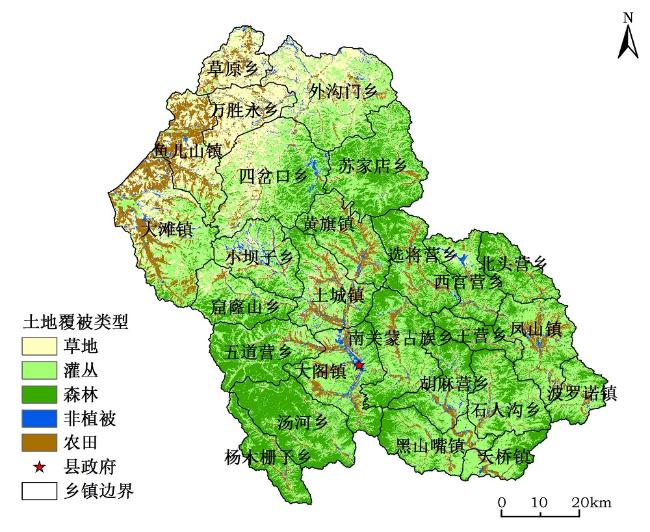
Figure 2 Land cover classification of Fengning County based on GF-1 WFV in 2015图2 基于GF-1 WFV的2015年丰宁县土地覆被分类结果 |
Table 3 Comparison between results of SCRM for predicting forest aboveground biomass in Fengning County表3 丰宁县森林地上生物量SCRM拟合结果及精度检验 |
| 回归模型 | 显著性 | 模型决定系数R2 | 均方根误差RMSE/(t/hm2) | 平均相对误差MRE/% |
|---|---|---|---|---|
| y=2 123.870(GNDVI)2-2 244.564(GNDVI)+620.666 | 0.002 | 0.475 | 33.164 | 45.25 |
| y=428.107(GNDVI)-200.314 | 0.002 | 0.375 | 35.258 | 42.99 |
| y=16.829e0.150(RVI) | 0.002 | 0.382 | 0.543 | 38.81 |
| y=9.398(RVI)-2.274 | 0.003 | 0.362 | 35.628 | 38.73 |
Table 4 Comparison between results of SCRM for predicting shrub aboveground biomass in Fengning County表4 丰宁县灌丛地上生物量SCRM拟合结果及精度检验 |
| 回归模型 | 显著性 | 模型决定系数R2 | 均方根误差RMSE/(t/hm2) | 平均相对误差MRE/% |
|---|---|---|---|---|
| y=3.019e0.105(RVI) | 0.000 | 0.620 | 0.232 | 33.17 |
| y=88.914(NDVI)2-104.132(NDVI)+34.807 | 0.000 | 0.615 | 1.619 | 33.57 |
| y=0.014(RVI)2+0.524(RVI)+2.290 | 0.001 | 0.608 | 1.705 | 32.72 |
| y=0.728(RVI)+1.647 | 0.000 | 0.606 | 1.658 | 32.53 |
Table 5 Comparison between results of SCRM for predicting grasslands aboveground biomass in Fengning County表5 丰宁县草地地上生物量SCRM拟合结果及精度检验 |
| 回归模型 | 显著性 | 模型决定 系数R2 | 均方根误差RMSE/(t/hm2) | 平均相对误差MRE/% |
|---|---|---|---|---|
| y=0.021(RVI)2+0.005(RVI)+0.748 | 0.000 | 0.758 | 0.333 | 28.91 |
| y=18.750(MSAVI)2-11.767(MSAVI)+2.783 | 0.000 | 0.723 | 0.356 | 30.61 |
| y=30.409(SAVI)2-21.155(SAVI)+4.601 | 0.000 | 0.723 | 0.356 | 30.56 |
| y=0.272(RVI)+0.083 | 0.000 | 0.719 | 0.350 | 31.33 |
Table 6 Accuracy checks results of MLRM for different vegetation type in Fengning County表6 丰宁县各植被类型的MLRM精度检验 |
| 植被类型 | 显著性 | 模型决定 系数R2 | 均方根误差RMSE/(t/hm2) | 平均相对 误差MRE/% |
|---|---|---|---|---|
| 森林 | 0.001 | 0.528 | 31.431 | 43.96 |
| 灌丛 | 0.000 | 0.606 | 1.658 | 35.72 |
| 草地 | 0.000 | 0.777 | 0.319 | 20.38 |
Table 7 Biomass,carbon density and carbon storage for different vegetation type of Fengning County in 2015表7 2015年丰宁县不同植被的生物量、碳密度及碳储量 |
| 植被类型 | 生物量 /(t/hm2) | 碳密度 /(tC/hm2) | 碳储量 /TgC | 碳比例 /% |
|---|---|---|---|---|
| 森林 | 110.813 | 55.406 | 15.714 | 93.48 |
| 灌丛 | 6.608 | 3.304 | 1.016 | 6.04 |
| 草地 | 1.185 | 0.533 | 0.080 | 0.48 |
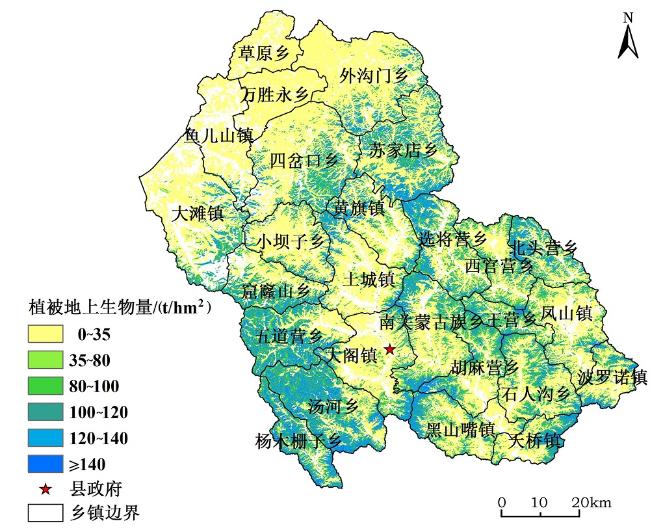
Figure 3 Spatial distribution of vegetation aboveground biomass of Fengning County in 2015图3 2015年丰宁县植被地上生物量空间分布 |
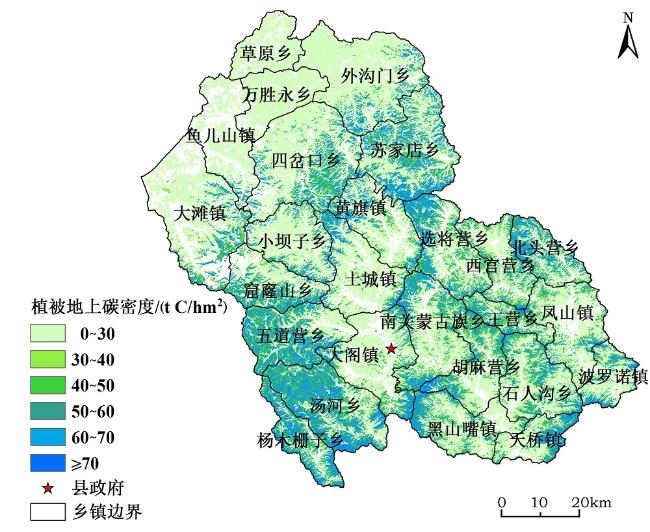
Figure 4 Spatial distribution of vegetation aboveground carbon density of Fengning County in 2015图4 2015年丰宁县植被地上碳密度空间分布 |
Table 8 Variation in vegetation carbon density and carbon storage with altitude in Fengning County表 8 丰宁县植被碳密度与碳储量随海拔变化情况 |
| 海拔/m | 碳密度/(tC/hm2) | 碳储量/TgC | 总碳密度 /(tC/hm2) | 总碳储量 /TgC | ||||
|---|---|---|---|---|---|---|---|---|
| 森林 | 灌丛 | 草地 | 森林 | 灌丛 | 草地 | |||
| 300~700 | 49.597 | 3.470 | 0.481 | 0.601 | 0.192 | 0.001 | 53.548 | 0.794 |
| 700~1 100 | 53.256 | 3.273 | 0.478 | 5.706 | 0.459 | 0.008 | 57.007 | 6.173 |
| 1 100~1 500 | 58.161 | 3.262 | 0.534 | 6.536 | 0.297 | 0.055 | 61.957 | 6.888 |
| 1 500~1 900 | 55.508 | 3.254 | 0.547 | 2.714 | 0.066 | 0.036 | 59.309 | 2.816 |
| 1 900~2 300 | 52.466 | 3.253 | 0.683 | 0.138 | 0.001 | 0.000 | 56.402 | 0.139 |
The authors have declared that no competing interests exist.
| [1] |
[
|
| [2] |
|
| [3] |
|
| [4] |
|
| [5] |
[
|
| [6] |
[
|
| [7] |
[
|
| [8] |
|
| [9] |
[
|
| [10] |
[
|
| [11] |
[
|
| [12] |
[
|
| [13] |
[
|
| [14] |
[
|
| [15] |
[
|
| [16] |
[
|
| [17] |
中国资源卫星应用中心.[EB/OL].[2015-02-22].
[China Centre For Resources Satellite Data and Application.[EB/OL].[2015-02-22].
|
| [18] |
日本地球遥感观测数据分析中心.[EB/OL].[2015-02-22].
[Japan Earth Remote Sensing Data Analysis Center Observation[EB/OL].[2015-02-22].
|
| [19] |
[
|
| [20] |
[
|
| [21] |
|
| [22] |
[
|
| [23] |
|
| [24] |
|
| [25] |
|
| [26] |
|
| [27] |
|
| [28] |
|
| [29] |
|
| [30] |
|
| [31] |
[
|
| [32] |
[
|
| [33] |
[
|
| [34] |
[
|
| [35] |
[
|
| [36] |
[
|
| [37] |
|
| [38] |
[
|
| [39] |
|
| [40] |
[
|
/
| 〈 |
|
〉 |