
Characteristics of impervious surface changes across coastal China
Received date: 2015-07-24
Request revised date: 2016-03-23
Online published: 2016-05-23
Copyright
The coastal zone is a frontier zone of economic development in China. The degree of utilization of the coastal zone is gradually increased because of convenient transportation. The coastal zone comprises fragile ecosystem and ecotones. Therefore,long-term over-exploitation and utilization would cause serious deterioration of ecological environment. This article analyzed relationships between key indicators of regional economic and social development and impervious surface area from remote sensing,and occupancy compensation relationships between impervious surface expansion and ecological land reduction. We found that during 2000-2008,the area of coastal zone impervious surface continued to increase in China and was positively correlated with economics and population. In general,GDP density had a better correlation with impervious surface rate than population. In the nine years,economic value added per unit of land improved. The average added value was 29.868 million CNY per square kilometer. Population density increased by an average of 181 persons per square kilometer. From 2000-2008, the expansion of the impervious surface of China's coastal zone included the increase of impervious surface area and impervious surface ratio. The increase of impervious surface area were mainly come from the occupation of cultivated land and ecological land. The expansion of impervious surface was constrained by the local natural geographical features, such as topography, elevation, slope and other factors. The impervious surface expansion were mainly from occupation of cultivated land in the seven economic zones coast. However, in different buffer levels, the impervious surface occupation intensity of cultivated land and ecological land showed obvious regional difference. The southern three economic zones (Beibu Gulf zone, west coast of the Taiwan Strait zone, the Pearl River Delta zone) had higher strength then the northern three economic zones(Beijing-Tianjin-Tangshan zone, Liaodong Bay and Liaodong Peninsula zone, Shandong Peninsula zone) in impervious surface occupation of ecological land. The reason may be that these regions have large area proportion of ecological land. In the future,the protection and development planning of the coastal zone should consider the regional differences of the ecological background, and then seek a more reasonable proportion of ecological land, cultivated land and construction land.
Key words: impervious surface; coastal zone; socioeconomic; ecological land; spatial analysis
ZHAI Jun , XIAO Tong , YANG Min , SUN Chenxi . Characteristics of impervious surface changes across coastal China[J]. Resources Science, 2016 , 38(5) : 814 -824 . DOI: 10.18402/resci.2016.05.02
Table 1 The area and impervious surface change statistics table of national nearly coastal zone from 2000 to 2008表1 2000-2008年中国海岸带面积及不透水地表面积变化统计 |
| 省份 | 海岸带 面积 /km2 | 2008年不透水地表面积 /km2 | 2008年不透水地表面积占海岸带面积比例/% | 2008年不透水地表增量占海岸带面积比例/% | 不透水面 增量 /km2 | GDP增量/亿元 | 人口增量 /万人 |
|---|---|---|---|---|---|---|---|
| 上海 | 1 538.3 | 560.3 | 36.4 | 12.6 | 194.1 | 9 147.0 | 214 |
| 天津 | 1 046.0 | 422.0 | 40.3 | 4.7 | 49.1 | 4 715.0 | 175 |
| 辽宁 | 11 035.4 | 1 753.2 | 15.9 | 0.7 | 79.2 | 8 792.5 | 77 |
| 河北 | 3 106.3 | 1 285.2 | 41.4 | 1.1 | 34.4 | 11 099.6 | 245 |
| 山东 | 14 287.3 | 3 462.9 | 24.2 | 4.3 | 609.5 | 22 529.7 | 338 |
| 江苏 | 7 384.1 | 1 528.0 | 20.7 | 1.5 | 112.4 | 22 399.3 | 239 |
| 浙江 | 9 841.8 | 1 156.1 | 11.8 | 4.8 | 467.5 | 15 450.6 | 443 |
| 福建 | 12 256.2 | 1 764.9 | 14.4 | 5.7 | 702.1 | 6 903.0 | 133 |
| 广东 | 20 250.0 | 2 407.3 | 11.9 | 1.5 | 308.5 | 26 034.2 | 902 |
| 广西 | 4 617.1 | 396.7 | 8.6 | 0.2 | 9.3 | 5 121.4 | 327 |
| 海南 | 9 216.1 | 512.9 | 5.6 | 0.8 | 70.7 | 940.8 | 67 |
| 港澳台 | 10 098.1 | 1 033.7 | 10.2 | 10.5 | 108.9 | - | - |
| 合计 | 104 676.7 | 16 283.2 | 241.4 | 48.4 | 2 636.8 | - | - |
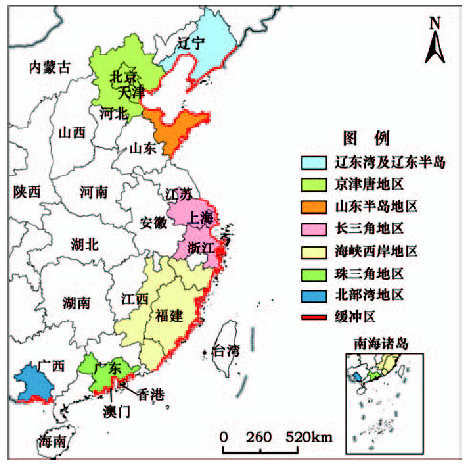
Figure 1 Spatial distribution of typical zones and 10km buffer图1 典型区及10km缓冲区空间分布 |
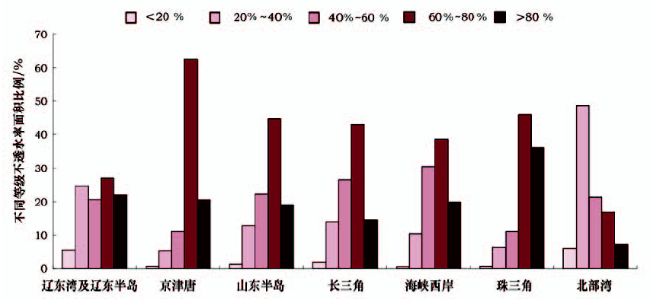
Table 2 The area of different impervious rate grades of typical zones in 2008 (km2)表2 2008年典型区不同等级不透水率面积 |
| 不透水率范围/% | 辽东湾及辽东半岛 | 京津唐 | 山东半岛 | 长三角 | 海峡西岸 | 珠三角 | 北部湾 |
|---|---|---|---|---|---|---|---|
| 0~20 | 95.69 | 10.81 | 43.44 | 30.38 | 11.50 | 7.19 | 23.25 |
| 20~40 | 426.38 | 89.94 | 442.75 | 233.69 | 250.19 | 72.94 | 189.38 |
| 40~60 | 355.13 | 188.38 | 774.25 | 444.06 | 734.13 | 127.81 | 83.19 |
| 60~80 | 465.44 | 1 057.38 | 1 552.19 | 716.81 | 925.63 | 527.81 | 65.75 |
| 80~100 | 378.38 | 348.94 | 664.81 | 243.00 | 479.38 | 416.44 | 27.88 |
| 合计 | 1 721.02 | 1 695.45 | 3 477.44 | 1 667.94 | 2 400.83 | 1 152.19 | 389.45 |
Figure 2 Statistic results of area proportion of impervious rate in typical zones图2 典型区不同等级不透水率面积比例统计结果 |
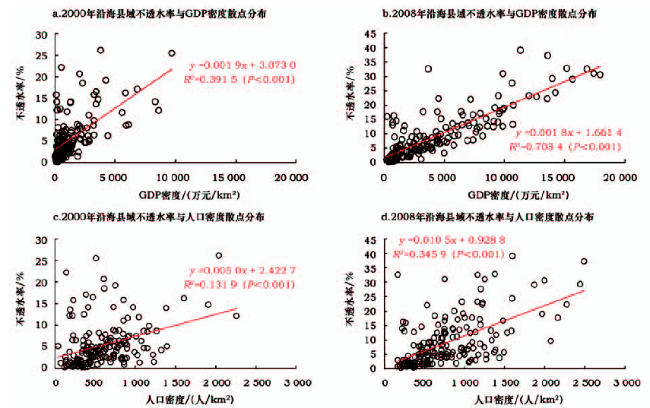
Figure 3 The relationship of Chinese coastal impervious surface area increase and social and economic statistics in 2000, in 2008(exclude Hongkong Macau and Taiwan)图3 2000年、2008年中国海岸带沿海县域不透水率与社会经济统计数据散点分布(不包括港澳台地区) |
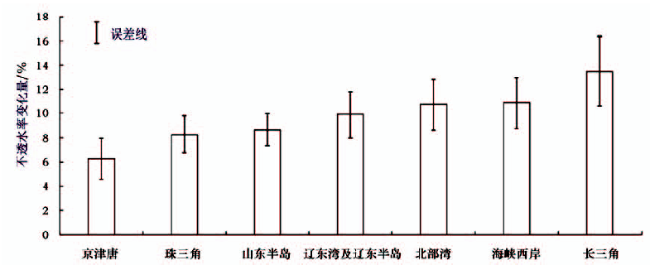
Table 3 The ecological land and farmland area and proportion of impervious surface increase occupancy for typical zones from 2000 to 2008表3 2000-2008年典型区不透水地表增加占用生态用地和耕地面积及其比例 |
| 典型区 | 占用生态用地比例 /% | 占用生态用地面积 /km2 | 占用耕地比例 /% | 占用耕地面积 /km2 | 不透水地表扩展比例/% |
|---|---|---|---|---|---|
| 珠三角 | 61.9 | 108.3 | 38.1 | 66.5 | 43.1 |
| 京津唐 | 29.6 | 50.5 | 67.6 | 115.5 | 13.5 |
| 辽东湾及辽东半岛 | 27.5 | 82.5 | 72.5 | 217.8 | 31.7 |
| 海峡西岸 | 26.1 | 176.8 | 73.8 | 499.0 | 63.9 |
| 北部湾 | 24.3 | 34.5 | 75.4 | 107.0 | 65.1 |
| 山东半岛 | 22.8 | 135.8 | 74.6 | 444.5 | 31.9 |
| 长三角 | 8.3 | 36.5 | 91.7 | 405.0 | 53.6 |
Figure 4 The impervious surface area index increase for typical zones from 2000 to 2008图4 2000-2008年典型区不透水率增加情况 |
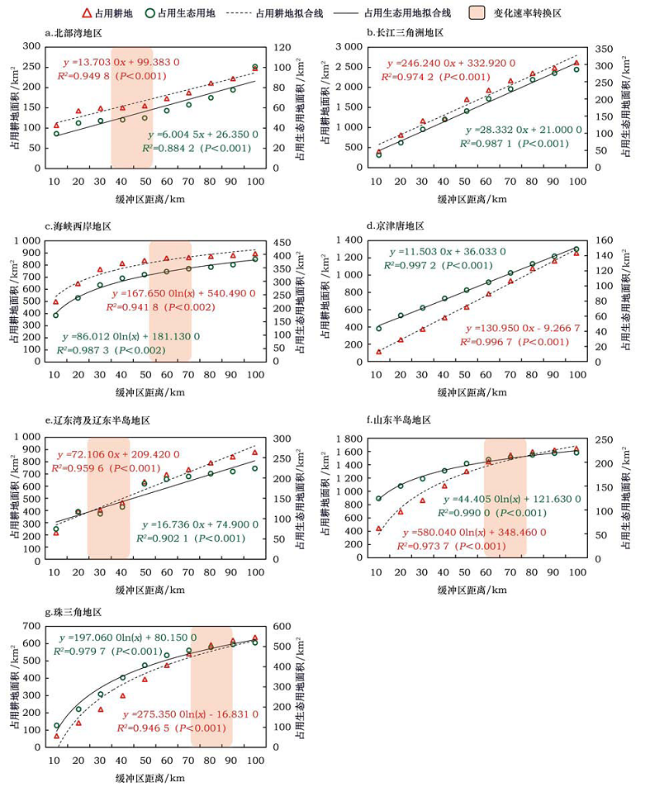
Figure 5 The farmland and ecological land area change of impervious surface occupancy for typical zones from 2000 to 2008图5 2000-2008年不同典型区在不同缓冲区范围内不透水地表占用耕地和生态用地面积变化 |
The authors have declared that no competing interests exist.
| [1] |
[
|
| [2] |
|
| [3] |
[
|
| [4] |
[
|
| [5] |
[
|
| [6] |
[
|
| [7] |
|
| [8] |
[
|
| [9] |
|
| [10] |
|
| [11] |
[
|
| [12] |
[
|
| [13] |
[
|
| [14] |
环境保护部、中国科学院. 全国生态环境十年变化(2000-2010年)遥感调查与评估. 北京:科学出版社,2014.
[Ministry of Environmental Protection,Chinese Academy of Sciences. Remote sensing investigation and assessment on eco-environment changes from 2000 to 2010 of China. Beijing:Science Press,2014.]
|
| [15] |
[
|
| [16] |
|
| [17] |
[
|
| [18] |
|
| [19] |
|
| [20] |
|
| [21] |
|
| [22] |
国家统计局. 中国城市统计年鉴2001[M]. 北京:中国统计出版社,2001.
[National Bureau of Statistics of China. Urban Statis-tical Yearbook of China 2001[M]. Beijing:China Statistics Press,2001.]
|
| [23] |
国家统计局. 中国城市统计年鉴2011[M]. 北京:中国统计出版社,2011.
[National Bureau of Statistics of China. Urban Statis-tical Yearbook of China 2011[M]. Beijing:China Statistics Press,2011.]
|
| [24] |
国家统计局. 中国县(市)经济统计年鉴2001[M]. 北京:中国统计出版社,2001.
[National Bureau of Statistics of China. Counties’ Economic Statistical Yearbook of China 2001[M]. Beijing:China Statistics Press,2001.]
|
| [25] |
国家统计局. 中国县(市)经济统计年鉴2011[M]. 北京:中国统计出版社,2011.
[National Bureau of Statistics of China. Counties’ Economic Statistical Yearbook of China 2011[M]. Beijing:China Statistics Press,2011.]
|
| [26] |
|
| [27] |
|
| [28] |
|
| [29] |
[
|
| [30] |
[
|
| [31] |
[
|
| [32] |
[
|
| [33] |
|
| [34] |
|
/
| 〈 |
|
〉 |