
Petroleum terminal utilization carbon emissions in China based on regional differences
Received date: 2015-04-10
Request revised date: 2015-09-15
Online published: 2016-02-01
Copyright
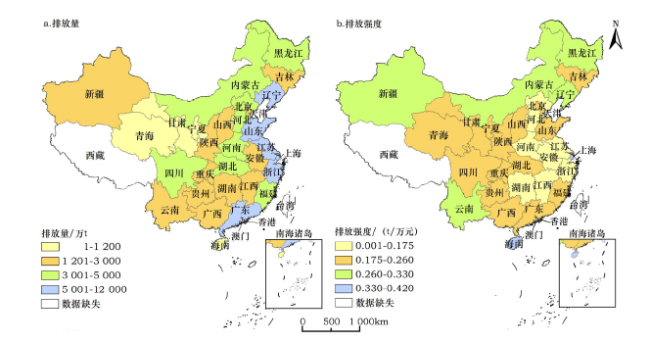
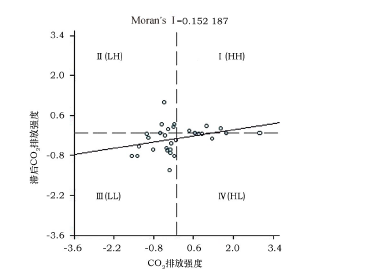
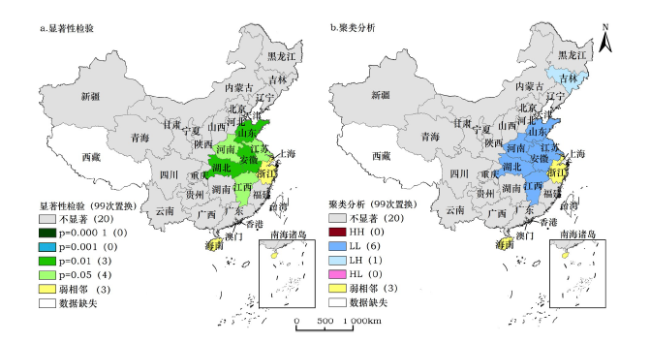
There are differences in CO2 emissions resulting from petroleum terminal utilization consumption among regions in China. This paper investigated a proper method to measure CO2 emissions from petroleum terminal utilization consumption in China using data from 30 provinces. To study carbon emission spatial distribution features we used the Moran’I model and found that the emissions intensity of China's petroleum terminal utilization showed universal positive spatial correlation; specifically,spatial correlation based and partial spatial discontinuity/mutation supplemented. It turns out that northeast and northwest regions were the main areas of high emission intensity,the western region had relatively high emission intensity as a whole,and the mid-eastern region had relatively low emission intensity. Shandong,Henan,Anhui,Jiangsu,Hubei and Jiangxi in eastern and central China were clusters of low CO2 emission intensity,surrounding provinces also showed low CO2 emission intensity. However,Jilin was in the CO2 emission intensity depression,and looking forward,Jilin could serve as a model for surrounding provinces such as Heilongjiang,Liaoning,and Inner Mongolia which mostly have a high CO2 emission intensity. The emission intensity had positive and strong relations with economic development level,energy conditions and industrial structures in these provinces. Therefore,to develop regional carbon emission reduction policy,governments should develop demission policy with regional subdivision and fully consider the practical situation of each province. Governments should also develop an overall plan to coordinate and promote the optimization of industry structure and energy structure.
GU Mengchen , WANG Limao . Petroleum terminal utilization carbon emissions in China based on regional differences[J]. Resources Science, 2016 , 38(2) : 255 -264 . DOI: 10.18402/resci.2016.02.08
Table 1 Carbon dioxide emission in unit quantity of different petroleum products表1 各油品单位实物量CO2排放系数 |
| 燃料类型 | 单位实物量CO2排放系数(kg-CO2/kg) |
|---|---|
| 汽油 | 2.925 |
| 柴油 | 3.096 |
| 煤油 | 3.018 |
| 燃料油 | 3.171 |
Table 2 CO2 emission and CO2 emission intensity of petroleum terminal use in each China’s province in 2011表2 2011年中国分省区石油终端利用CO2排放量和CO2排放强度 |
| 省区 | CO2 排放量 /万t | CO2排放 强度 /(t/万元) | 省区 | CO2 排放量 /万t | CO2排放 强度 /(t/万元) | |
|---|---|---|---|---|---|---|
| 北京 | 3 182 | 0.196 | 河南 | 3 370 | 0.125 | |
| 天津 | 2 151 | 0.190 | 湖北 | 4 060 | 0.207 | |
| 河北 | 3 527 | 0.144 | 湖南 | 2 904 | 0.148 | |
| 山西 | 2 229 | 0.198 | 广东 | 10 018 | 0.188 | |
| 内蒙古 | 3 871 | 0.270 | 广西 | 2 392 | 0.204 | |
| 辽宁 | 6 517 | 0.293 | 海南 | 1 013 | 0.402 | |
| 吉林 | 1 933 | 0.183 | 重庆 | 1 842 | 0.184 | |
| 黑龙江 | 3 512 | 0.279 | 四川 | 4 314 | 0.205 | |
| 上海 | 6 328 | 0.330 | 贵州 | 1 441 | 0.253 | |
| 江苏 | 5 370 | 0.109 | 云南 | 2 779 | 0.313 | |
| 浙江 | 5 639 | 0.174 | 陕西 | 2 621 | 0.210 | |
| 安徽 | 1 868 | 0.122 | 甘肃 | 892 | 0.178 | |
| 福建 | 3 486 | 0.199 | 青海 | 401 | 0.240 | |
| 江西 | 1 855 | 0.158 | 宁夏 | 403 | 0.192 | |
| 山东 | 8 890 | 0.196 | 新疆 | 1 731 | 0.262 |
注:由于统计数据不足,分析中未包含港澳台和西藏。 |
Figure 1 CO2 emission and CO2 emission intensity of petroleum terminal use in the provinces of China in 2011图1 2011年中国分省区石油终端利用CO2排放量和排放强度 |
Figure 2 Moran scatter diagram of carbon dioxide emission intensity of petroleum terminal use among China’s provinces in 2011图2 2011年中国各省区石油终端利用CO2排放强度Moran散点 |
Figure 3 Spatial correlation Significance testing and cluster analysis of CO2 emission intensity of petroleum terminal use among China’s provinces in 2011图3 2011年中国各省区石油终端利用CO2排放强度空间分布相关性的显著性检验和空间聚类分析结果 |
Table 3 Correlation coefficient matrix表3 相关系数矩阵 |
| lnCEI | lnGDPPC | lnPRRC | lnIS | ||
|---|---|---|---|---|---|
| 皮尔森 | lnCEI | 1.000 | 0.355 | 0.626 | 0.642 |
| 相关系数 | lnGDPPC | 0.355 | 1.000 | 0.066 | 0.128 |
| lnPRRC | 0.626 | 0.066 | 1.000 | 0.691 | |
| lnIS | 0.642 | 0.128 | 0.691 | 1.000 | |
| Sig.(1-tailed) | lnCEI | - | 0.044 | 0.001 | 0.000 |
| lnGDPPC | 0.044 | - | 0.379 | 0.275 | |
| lnPRRC | 0.001 | 0.379 | - | 0.000 | |
| lnIS | 0.000 | 0.275 | 0.000 | - |
The authors have declared that no competing interests exist.
| [1] |
IEA. CO2 Emissions from Fuel Combustion Highlights2013[EB/OL]. (2014-01)[2015-04-09]. http://www.iea.org/publications/freepublications/publication/name,43840,en.html.
|
| [2] |
中国石油经济技术研究院. 2013年国内外油气行业发展报告[R]. 北京:中国石油经济技术研究院,2014.
[CNPC Economics & Technology Research Institute. The Development of Oil & Gas Industry at Home and Abroad 2013[R]. Beijing:China Economic and Technical Research Institute of Petroleum,2014.]
|
| [3] |
[
|
| [4] |
|
| [5] |
[
|
| [6] |
[
|
| [7] |
[
|
| [8] |
[
|
| [9] |
[
|
| [10] |
[
|
| [11] |
[
|
| [12] |
国家统计局工业交通统计司. 中国能源统计年鉴[M]. 北京:中国统计出版社,1997-2013.
[
|
| [13] |
国家质量监督检验检疫总局,中国国家标准化管理委员会. 综合能耗计算通则(GB/T 2589-2008)[M]. 北京:中国标准出版社,2008.
[The State Administration of Quality Supervision,Inspection and Quarantine,China National Standardization Management Committee. General Principles for Calculation of the Comprehensive Energy Consumption(GB/T 2589-2008)[M]. Beijing:China Standards Press,2008.]
|
| [14] |
国家发展和改革委员会气候办. 省级温室气体清单编制指南([2011]1041号)[EB/OL]. (2011-05)[2015-04-09]. http://www.docin.com/p-661876050.html.
[
|
| [15] |
Intergovernmental Panel on Climate Change (IPCC).Good Practice Guidelines for National Greenhouse Gas Inventories and Uncertainty Management[M]. Hayama:National Institute for Environmental Studies Japan (IGES),2000.
|
| [16] |
|
| [17] |
[
|
| [18] |
[
|
| [19] |
[
|
| [20] |
[
|
| [21] |
国家统计局. 中国统计年鉴[M]. 北京:中国统计出版社,1997-2003.
[
|
| [22] |
[
|
| [23] |
[
|
/
| 〈 |
|
〉 |