
Modelling the impacts of climate change on spring maize yield in Southwest China using the APSIM model
Received date: 2015-05-11
Request revised date: 2015-07-23
Online published: 2016-01-25
Copyright
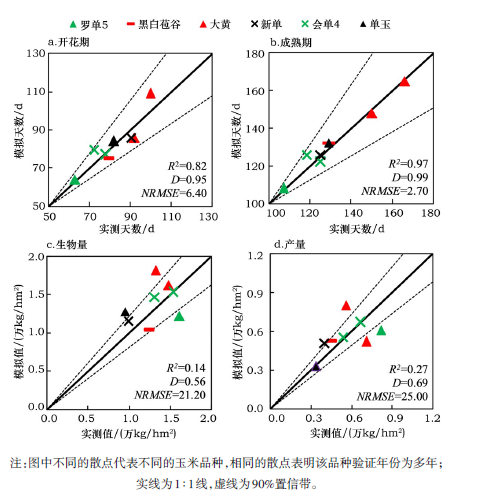
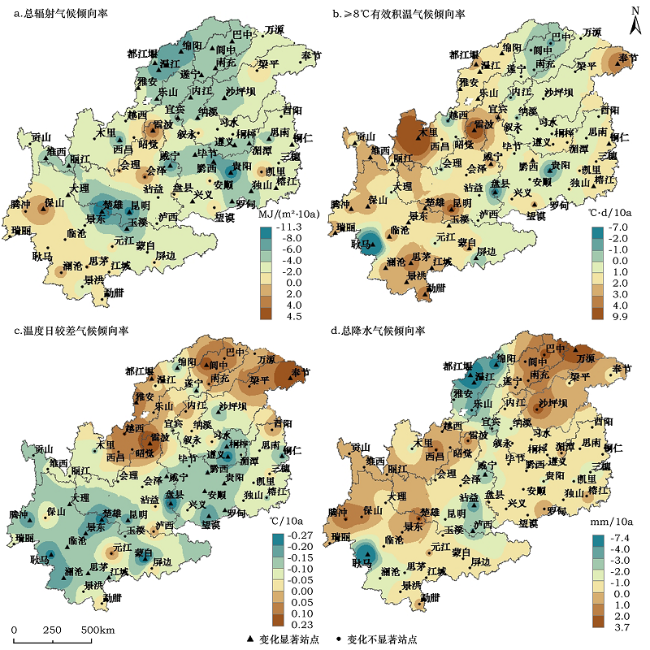
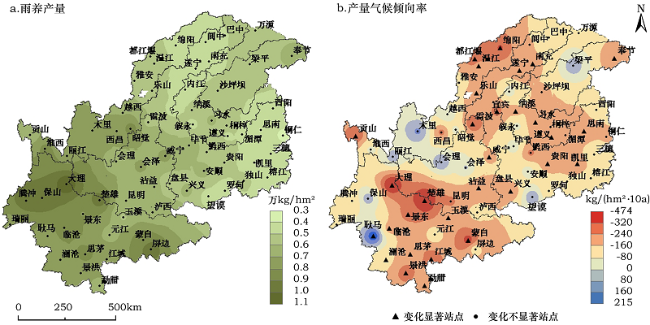
The APSIM-Maize model was calibrated and validated using crop and soil data from agro-meteorological experimental stations in maize planting zones in Southwest China (SWC). The spatiotemporal distribution characteristics in simulated rainfed yield of spring maize were analyzed to explore the impacts of changes in main climatic factors during the maize growing season on yields from 1961 to 2010. We found that the APSIM model performed well in simulating phenology,above-ground biomass and yield of six representative spring maize varieties. The root mean squared error between simulated and observed growing periods was less than 8 d for all varieties and the normalized root mean squared error between simulated and observed above-ground biomass and yield was less than 29% for four varieties. Growing season total solar radiation decreased in the central,southern and northern SWC;≥8℃ accumulated temperature increased evidently in western SWC;daily diurnal temperature range decreased in western and southeastern SWC;and total precipitation decreased in central SWC. As a result,the simulated rainfed yield of spring maize declined at 46% of all study stations in SWC,especially in central,eastern and southern SWC. The contribution of decreasing solar radiation,increasing temperature,decreasing precipitation and decreasing diurnal temperature range during maize growing season to yield reduction was 32%,40%,1% and -2%,respectively,in stations which had a significant decline in yield.
DAI Tong , WANG Jing , HE Di , WANG Na . Modelling the impacts of climate change on spring maize yield in Southwest China using the APSIM model[J]. Resources Science, 2016 , 38(1) : 155 -165 . DOI: 10.18402/resci.2016.01.17
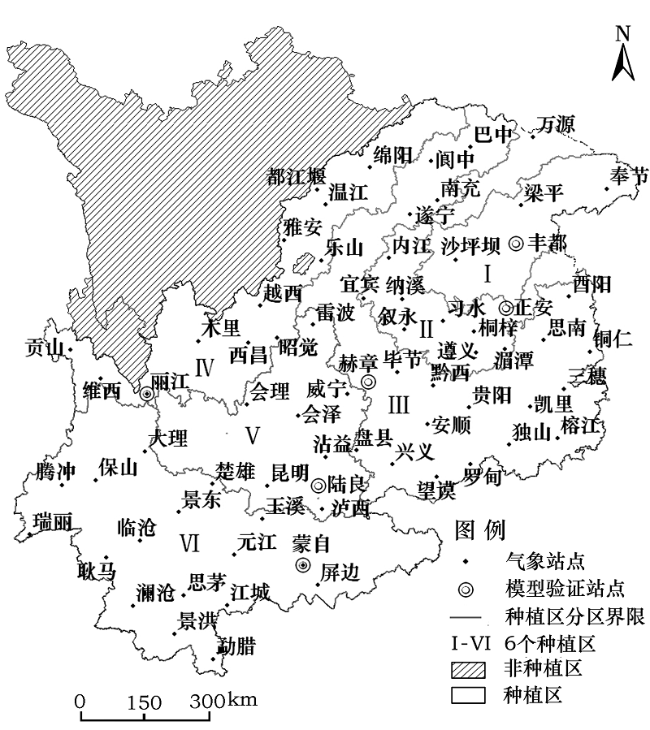
Figure 1 The planting districts and distribution of spring maize for the study sites in Southwest China图1 西南地区春玉米种植分区和研究站点分布 |
Table 1 Main soil types and distribution in Southwest China表1 西南地区主要土壤类型 |
| 土壤类型/站点数 | 站点名 | 省(市) |
|---|---|---|
| 紫色土/11 | 温江、绵阳、乐山、宜宾、阆中、遂宁、南充、梁平、内江、沙坪坝、纳溪 | 四川、重庆 |
| 红壤/24 | 木里、贡山、维西、西昌、会理、会泽、威宁、腾冲、保山、大理、楚雄、昆明、沾益、盘县、瑞丽、 玉溪、思南、铜仁、三穗、兴义、望谟、罗甸、独山、榕江、丽江 | 四川、云南、贵州 |
| 赤红壤/12 | 景东、泸西、耿马、临沧、澜沧、景洪、思茅、元江、勐腊、江城、蒙自、屏边 | 云南 |
| 黄壤/13 | 都江堰、雅安、桐梓、叙永、习水、酉阳、毕节、遵义、湄潭、黔西、安顺、贵阳、凯里 | 四川、重庆、贵州 |
| 黄棕壤/16 | 越西、昭觉、雷波、万源、巴中、奉节 | 四川、重庆 |
Table 2 Varieties and years data of spring maize for model calibration and validation in each planting district表2 典型种植区春玉米品种及用于模型调参和验证的资料年份 |
| 分区 | 站点 | 品种 | 调参年份 | 验证年份 |
|---|---|---|---|---|
| I | 重庆丰都 | 新单7 | 1981-1982 | 1983 |
| II | 贵州正安 | 单玉 | 1990-1991 | 1992 |
| III | 贵州赫章 | 黑白苞谷 | 1985-1986 | 1987 |
| IV | 云南丽江 | 大黄 | 1994-1995 | 1997-1998 |
| V | 云南陆良 | 会单4 | 1998-1999 | 2000-2001 |
| VI | 云南蒙自 | 罗单5 | 2005-2006 | 2007 |
Table 3 The sowing dates of spring maize in each planting district表3 春玉米不同种植区的播期 |
| 区域 | Ⅰ | Ⅱ | Ⅲ | Ⅳ | Ⅴ | Ⅵ |
|---|---|---|---|---|---|---|
| 播期 | 3月10日 | 3月20日 | 4月1日 | 4月10日 | 4月20日 | 5月1日 |
| 生长天数/d | 130 | 140 | 130 | 160 | 160 | 140 |
Table 4 Soil physical parameters of main soil types in Southwest China表4 西南地区主要土壤类型及物理特性参数 |
| 土壤类型 | 土壤参数 | 土层深度(cm) | |||||||||
|---|---|---|---|---|---|---|---|---|---|---|---|
| 0~10 | 10~20 | 20~30 | 30~40 | 40~50 | 50~60 | 60~70 | 70~80 | 80~90 | 90~100 | ||
| 紫色土 | ll15(mm/mm) | 0.17 | 0.17 | 0.16 | 0.16 | 0.16 | 0.18 | 0.18 | 0.18 | - | - |
| dull(mm/mm) | 0.31 | 0.31 | 0.31 | 0.31 | 0.31 | 0.32 | 0.32 | 0.32 | - | - | |
| sat(mm/mm) | 0.44 | 0.44 | 0.43 | 0.43 | 0.43 | 0.44 | 0.44 | 0.44 | - | - | |
| bd(g/cm3) | 1.49 | 1.49 | 1.51 | 1.51 | 1.51 | 1.50 | 1.50 | 1.50 | - | ||
| 红壤 | ll15(mm/mm) | 0.21 | 0.21 | 0.23 | 0.25 | 0.25 | 0.25 | 0.25 | 0.25 | 0.25 | 0.25 |
| dull(mm/mm) | 0.34 | 0.34 | 0.35 | 0.39 | 0.39 | 0.39 | 0.39 | 0.39 | 0.39 | 0.39 | |
| sat(mm/mm) | 0.47 | 0.47 | 0.46 | 0.47 | 0.47 | 0.47 | 0.47 | 0.47 | 0.47 | 0.47 | |
| bd(g/cm3) | 1.40 | 1.40 | 1.44 | 1.40 | 1.40 | 1.40 | 1.40 | 1.40 | 1.40 | 1.40 | |
| 赤红壤 | ll15(mm/mm) | 0.33 | 0.33 | 0.37 | 0.39 | 0.41 | 0.41 | 0.41 | 0.41 | 0.41 | - |
| dull(mm/mm) | 0.44 | 0.44 | 0.46 | 0.48 | 0.50 | 0.50 | 0.50 | 0.50 | 0.50 | - | |
| sat(mm/mm) | 0.52 | 0.52 | 0.54 | 0.56 | 0.58 | 0.58 | 0.58 | 0.58 | 0.58 | - | |
| bd(g/cm3) | 1.27 | 1.27 | 1.22 | 1.17 | 1.13 | 1.13 | 1.13 | 1.13 | 1.13 | - | |
| 黄壤 | ll15(mm/mm) | 0.16 | 0.15 | 0.15 | 0.15 | 0.15 | 0.15 | 0.15 | 0.15 | 0.15 | - |
| dull(mm/mm) | 0.29 | 0.28 | 0.28 | 0.28 | 0.28 | 0.28 | 0.28 | 0.27 | 0.27 | - | |
| sat(mm/mm) | 0.49 | 0.44 | 0.44 | 0.44 | 0.44 | 0.44 | 0.42 | 0.41 | 0.41 | - | |
| bd(g/cm3) | 1.35 | 1.48 | 1.49 | 1.49 | 1.49 | 1.49 | 1.53 | 1.57 | 1.57 | - | |
| 黄棕壤 | ll15(mm/mm) | 0.19 | 0.19 | 0.21 | 0.21 | 0.20 | 0.20 | 0.20 | 0.20 | 0.20 | 0.20 |
| dull(mm/mm) | 0.37 | 0.38 | 0.39 | 0.38 | 0.37 | 0.37 | 0.37 | 0.37 | 0.37 | 0.37 | |
| sat(mm/mm) | 0.63 | 0.63 | 0.63 | 0.58 | 0.55 | 0.55 | 0.55 | 0.55 | 0.55 | 0.55 | |
| bd(g/cm3) | 0.99 | 0.99 | 0.97 | 1.13 | 1.19 | 1.19 | 1.19 | 1.19 | 1.19 | 1.19 | |
Table 5 APSIM parameterization for six maize varieties used in the study表5 APSIM模型的玉米品种遗传参数 |
| 典型品种 | 出苗-营养生长期结束所需有效积温 /(·d) | 光周期 临界值 /h | 光周期 斜率 /(/h) | 开花-成熟所需有效积温 /(·d) | 穗最大籽 粒数 | 潜在灌浆 速率 /(mg/(graind)) |
|---|---|---|---|---|---|---|
| 新单7 | 200 | 12.5 | 10.0 | 700 | 500 | 10.0 |
| 单玉 | 180 | 12.5 | 10.0 | 750 | 470 | 9.0 |
| 黑白苞谷 | 170 | 12.5 | 9.0 | 730 | 470 | 9.0 |
| 大黄 | 185 | 12.5 | 9.0 | 650 | 510 | 10.0 |
| 会单4 | 130 | 12.5 | 10.0 | 530 | 570 | 10.0 |
| 罗单5 | 195 | 12.5 | 10.0 | 680 | 680 | 10.5 |
Figure 2 Comparison between simulated and measured phenology,biomass and yields of spring maize at the study stations图2 春玉米生育期、生物量和产量模拟值与实测值的比较 |
Figure 3 Change trends of growing season of spring maize in Southwest China from 1961 to 2010图3 1961-2010年西南地区春玉米生长季的气候倾向率 |
Figure 4 Mean value and change trends of simulated rainfed yields in Southwest China from 1961 to 2010图4 1961-2010年西南地区春玉米雨养产量的均值和气候倾向率 |
Table 6 Influence and contribution rate of growing season climate factors to simulated rainfed yield of spring maize in Southwest China表6 西南地区春玉米生长季气象因子对雨养产量的影响程度及贡献率 |
| 分区 | 站点 | 标准化回归系数 | 贡献率/% | ||||||
|---|---|---|---|---|---|---|---|---|---|
| 辐射 | 温度 | 温度日较差 | 降水 | 辐射 | 温度 | 温度日较差 | 降水 | ||
| Ⅰ | 奉节 | 0.186 | -0.352* | 0.231 | -0.050 | - | 32 | - | - |
| Ⅱ | 宜宾 | 0.360** | -0.502** | -0.031 | 0.001 | 40 | 32 | - | - |
| 纳溪 | 0.543** | -0.450** | -0.236 | 0.109 | -75 | 118 | - | - | |
| 习水 | 0.415** | -0.243 | 0.159 | 0.187 | 51 | - | - | - | |
| 遵义 | 0.509** | -0.030 | 0.084 | -0.067 | 84 | - | - | - | |
| Ⅲ | 遂宁 | 0.311* | -0.171 | -0.265 | 0.103 | 48 | - | - | - |
| 南充 | 0.446** | -0.056 | -0.234 | -0.010 | 60 | - | - | - | |
| 思南 | 0.376** | -0.124 | -0.280 | 0.040 | 64 | - | - | - | |
| 贵阳 | 0.063 | -0.199 | 0.528** | 0.142 | - | - | 55 | - | |
| 凯里 | 0.360** | -0.322* | -0.020 | 0.014 | 47 | 13 | - | - | |
| 兴义 | 0.521** | -0.185 | 0.049 | -0.010 | 51 | - | - | - | |
| Ⅳ | 温江 | 0.539** | 0.067 | -0.399* | -0.093 | 98 | - | 6 | - |
| 都江堰 | 0.657** | 0.026 | -0.277* | 0.165 | 64 | - | 20 | - | |
| 绵阳 | 0.737** | 0.053 | -0.516** | 0.247* | 108 | - | -22 | 22 | |
| 乐山 | 0.385** | -0.153 | -0.104 | 0.017 | 54 | - | - | - | |
| 贡山 | 0.661** | -0.455** | -0.269 | 0.047 | 28 | 39 | - | - | |
| Ⅴ | 雷波 | 0.258* | -0.499** | -0.097 | 0.031 | 19 | 63 | - | - |
| 威宁 | 0.337* | -0.222 | -0.225 | -0.139 | 68 | - | - | - | |
| 沾益 | 0.446** | -0.294 | -0.146 | 0.197 | 21 | - | - | - | |
| 玉溪 | 0.359** | -0.309* | 0.022 | -0.087 | 30 | 37 | - | - | |
| Ⅵ | 大理 | 0.828** | -0.431** | -0.421** | 0.043 | 42 | 56 | -23 | - |
| 楚雄 | 1.064** | -0.759** | -0.944** | -0.135 | 140 | 69 | -91 | - | |
| 景东 | 0.796** | -0.335** | -0.255* | 0.017 | -7 | 67 | -9 | - | |
| 耿马+ | 0.545** | -0.550** | -0.307 | 0.117 | -9 | 84 | - | - | |
| 临沧 | 0.743** | -0.512** | -0.197 | 0.020 | -52 | 144 | - | - | |
| 澜沧 | 0.543** | -0.450** | -0.236 | 0.109 | -75 | 118 | - | - | |
| 景洪 | 0.670** | -0.470** | -0.032 | -0.040 | 11 | 77 | - | - | |
| 思茅 | 0.725** | -0.508** | 0.066 | -0.124 | -54 | 127 | - | - | |
| 勐腊 | 0.880** | -0.457** | -0.199 | 0.028 | -14 | 142 | - | - | |
| 江城 | 0.690** | -0.388** | -0.002 | -0.185 | -4 | 87 | - | - | |
| 蒙自 | 0.854** | -0.522** | 0.007 | 0.078 | 35 | 57 | - | - | |
注:*和**分别为显著性水平p<0.05和p<0.01;+为该站增产。 |
The authors have declared that no competing interests exist.
| [1] |
[
|
| [2] |
|
| [3] |
[
|
| [4] |
|
| [5] |
[
|
| [6] |
[
|
| [7] |
[
|
| [8] |
[
|
| [9] |
|
| [10] |
|
| [11] |
|
| [12] |
|
| [13] |
|
| [14] |
|
| [15] |
|
| [16] |
|
| [17] |
|
| [18] |
[
|
| [19] |
[
|
| [20] |
[
|
| [21] |
[
|
| [22] |
|
| [23] |
[
|
| [24] |
[
|
| [25] |
[
|
| [26] |
[
|
| [27] |
[
|
| [28] |
[
|
| [29] |
[
|
| [30] |
|
| [31] |
|
| [32] |
|
| [33] |
|
| [34] |
|
| [35] |
|
| [36] |
[
|
| [37] |
[
|
| [38] |
[
|
| [39] |
[
|
| [40] |
[
|
| [41] |
[
|
| [42] |
[
|
/
| 〈 |
|
〉 |