世界天然气流动节点格局演化及其资源效应
王宜强1,2( ), 赵媛3
), 赵媛3
Evolution of the global pattern of natural gas flow nodes and its resource effect
WANG Yiqiang1,2(), ZHAO Yuan3
), ZHAO Yuan3
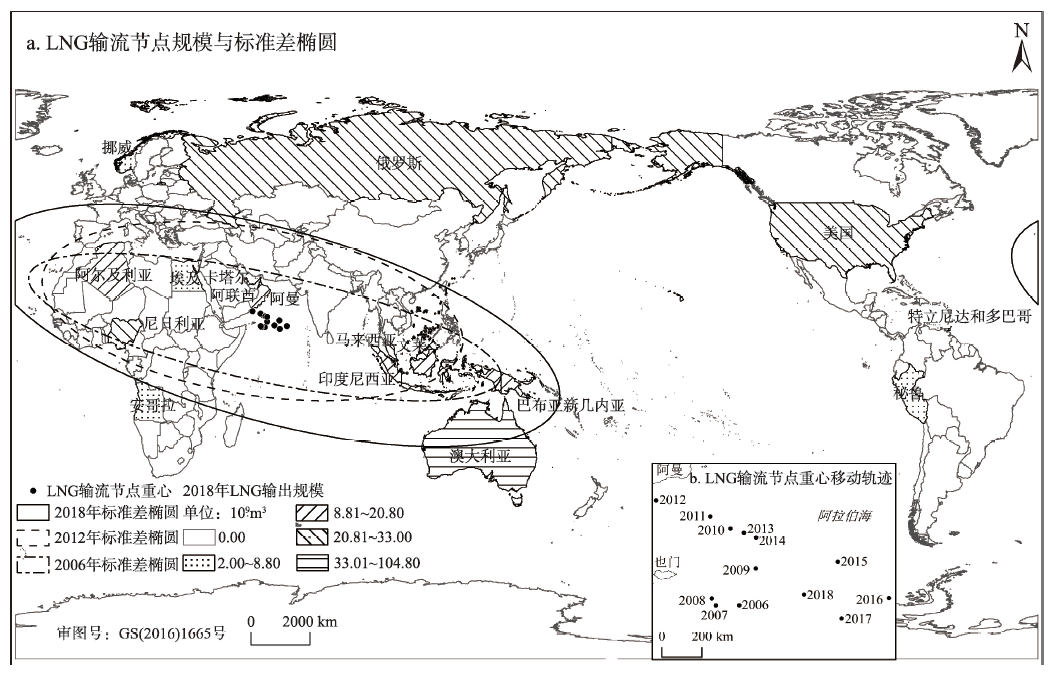
图3. 2006、2012和2018年液化天然气输流节点格局
Figure 3. Spatial pattern of liquefied natural gas (LNG) export nodes, 2006, 2012 and 2018